Fig. 6.
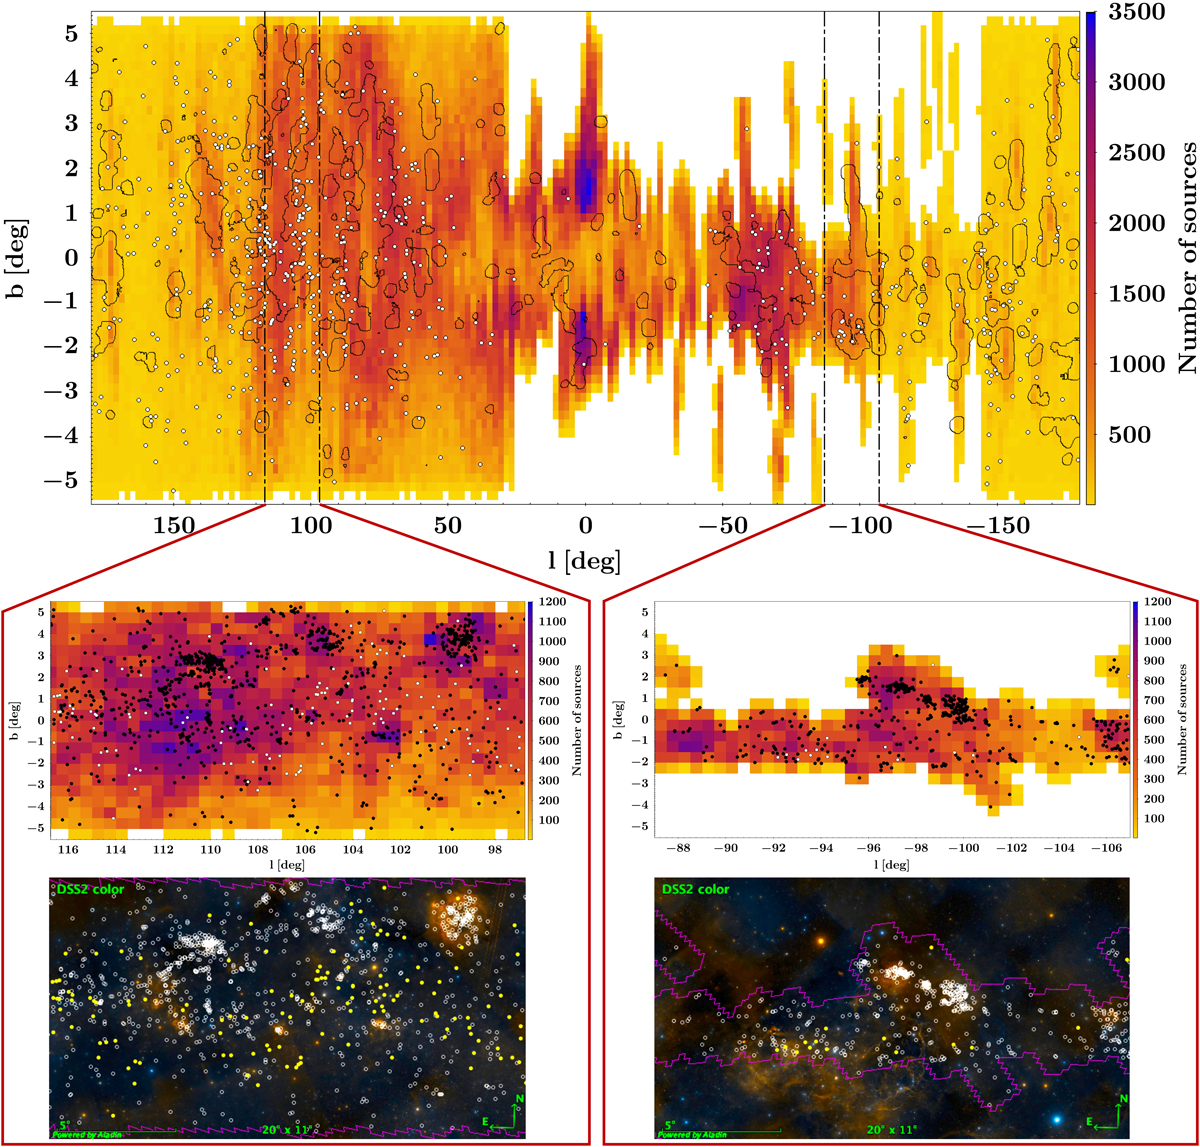
Top: sky footprint of the Sample of Study in galactic coordinates, colour-coded by number density. We note the heterogeneity of the footprint. The scarcity of sources between 29° > l > −145° is due to the incompleteness of VPHAS+ at the time of writing. Each pixel is 2° ×0.2°. PMS candidates overdensities appear as black contours. There are ten time more candidates inside than outside the contours. CBe candidates appear as white dots. Expanded regions at bottom panels appear between dashed lines. Middle: expanded regions. Each region is 20° ×11°. PMS contours are replaced by PMS candidates (black dots). Each pixel is 0.5° ×0.5°. Bottom: same expanded regions in DSS2 colour with the PMS candidates as white circles and the CBe candidates as yellow dots. Contours trace the footprint of the Sample of Study.
Current usage metrics show cumulative count of Article Views (full-text article views including HTML views, PDF and ePub downloads, according to the available data) and Abstracts Views on Vision4Press platform.
Data correspond to usage on the plateform after 2015. The current usage metrics is available 48-96 hours after online publication and is updated daily on week days.
Initial download of the metrics may take a while.