Fig. 4.
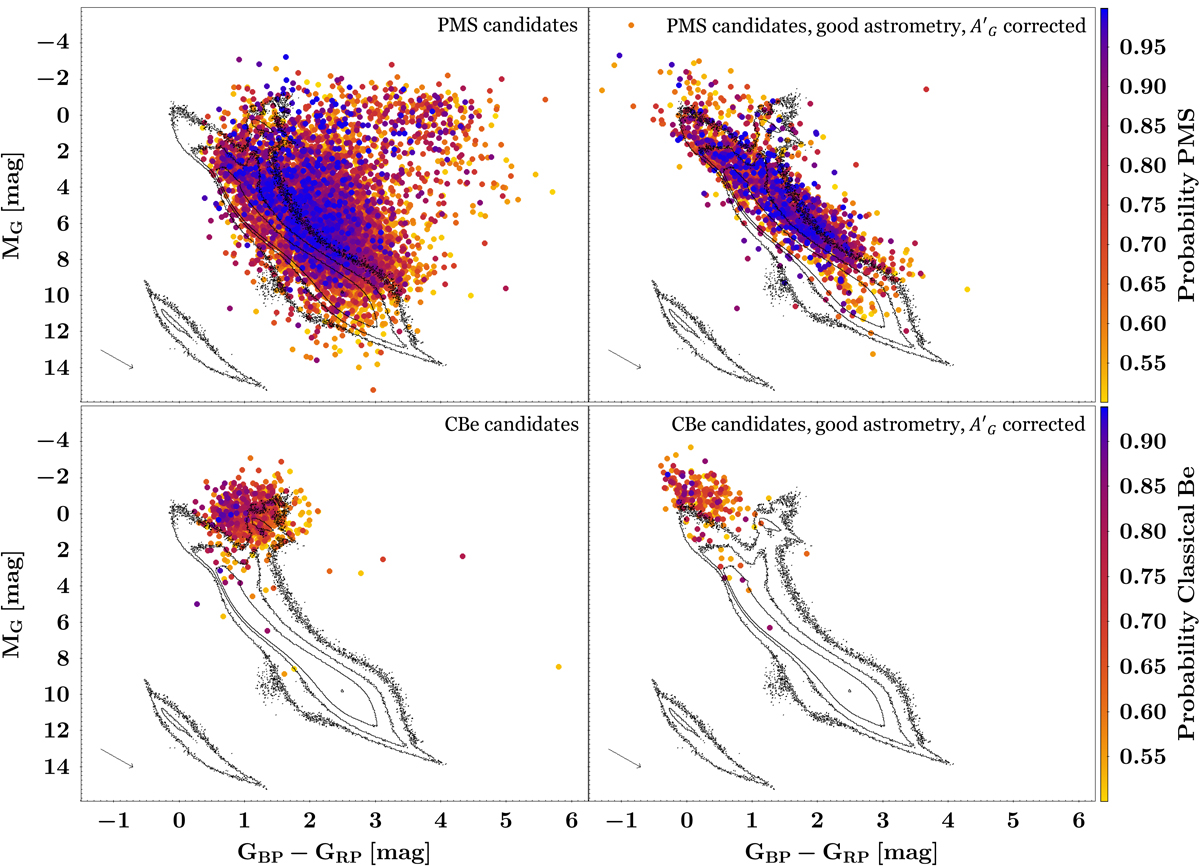
Gaia colour vs. absolute magnitude HR diagram. An extinction vector corresponding to AG = 1 is shown on the bottom left of each plot. Black contours trace Gaia sources within 500 pc with good astrometric solution. Top left: HR diagram of PMS candidates (p ≥ 50%) colour-coded by their associated membership probability. Top right: HR diagram of PMS candidates (p ≥ 50%) with good astrometric solution colour-coded by their associated membership probability and corrected from interstellar extinction. Bottom left: HR diagram of classical Be candidates (p ≥ 50%) colour-coded by their associated membership probability. Bottom right: HR diagram of classical Be candidates (p ≥ 50%) with good astrometric solution colour-coded by their associated membership probability and corrected from interstellar extinction.
Current usage metrics show cumulative count of Article Views (full-text article views including HTML views, PDF and ePub downloads, according to the available data) and Abstracts Views on Vision4Press platform.
Data correspond to usage on the plateform after 2015. The current usage metrics is available 48-96 hours after online publication and is updated daily on week days.
Initial download of the metrics may take a while.