Fig. B.2.
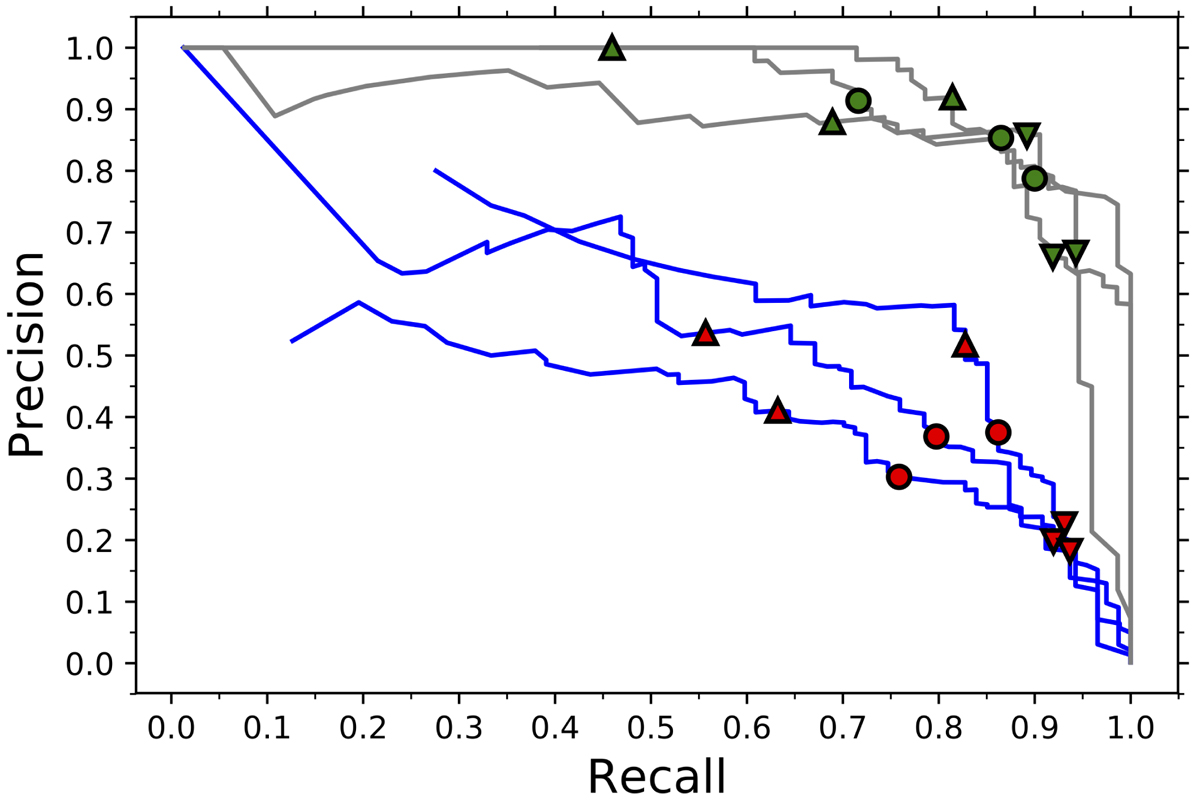
Precision vs. recall trade-off plot resulting after evaluation on test set for three different bootstrapped iterations. Blue lines correspond to PMS classification and grey lines to classical Be classification. Different probability thresholds (p) for selecting candidate objects correspond to different locations on the line. Upwards arrows (p ≥ 75%), circles (p ≥ 50%), and downwards arrows (p ≥ 25%) are examples of such probability thresholds. Some lines do not cover the whole metric space because evaluation stops whenever there are no longer true positives in the corresponding test set. The precision values are lower limits to the real precisions.
Current usage metrics show cumulative count of Article Views (full-text article views including HTML views, PDF and ePub downloads, according to the available data) and Abstracts Views on Vision4Press platform.
Data correspond to usage on the plateform after 2015. The current usage metrics is available 48-96 hours after online publication and is updated daily on week days.
Initial download of the metrics may take a while.