Fig. B.1.
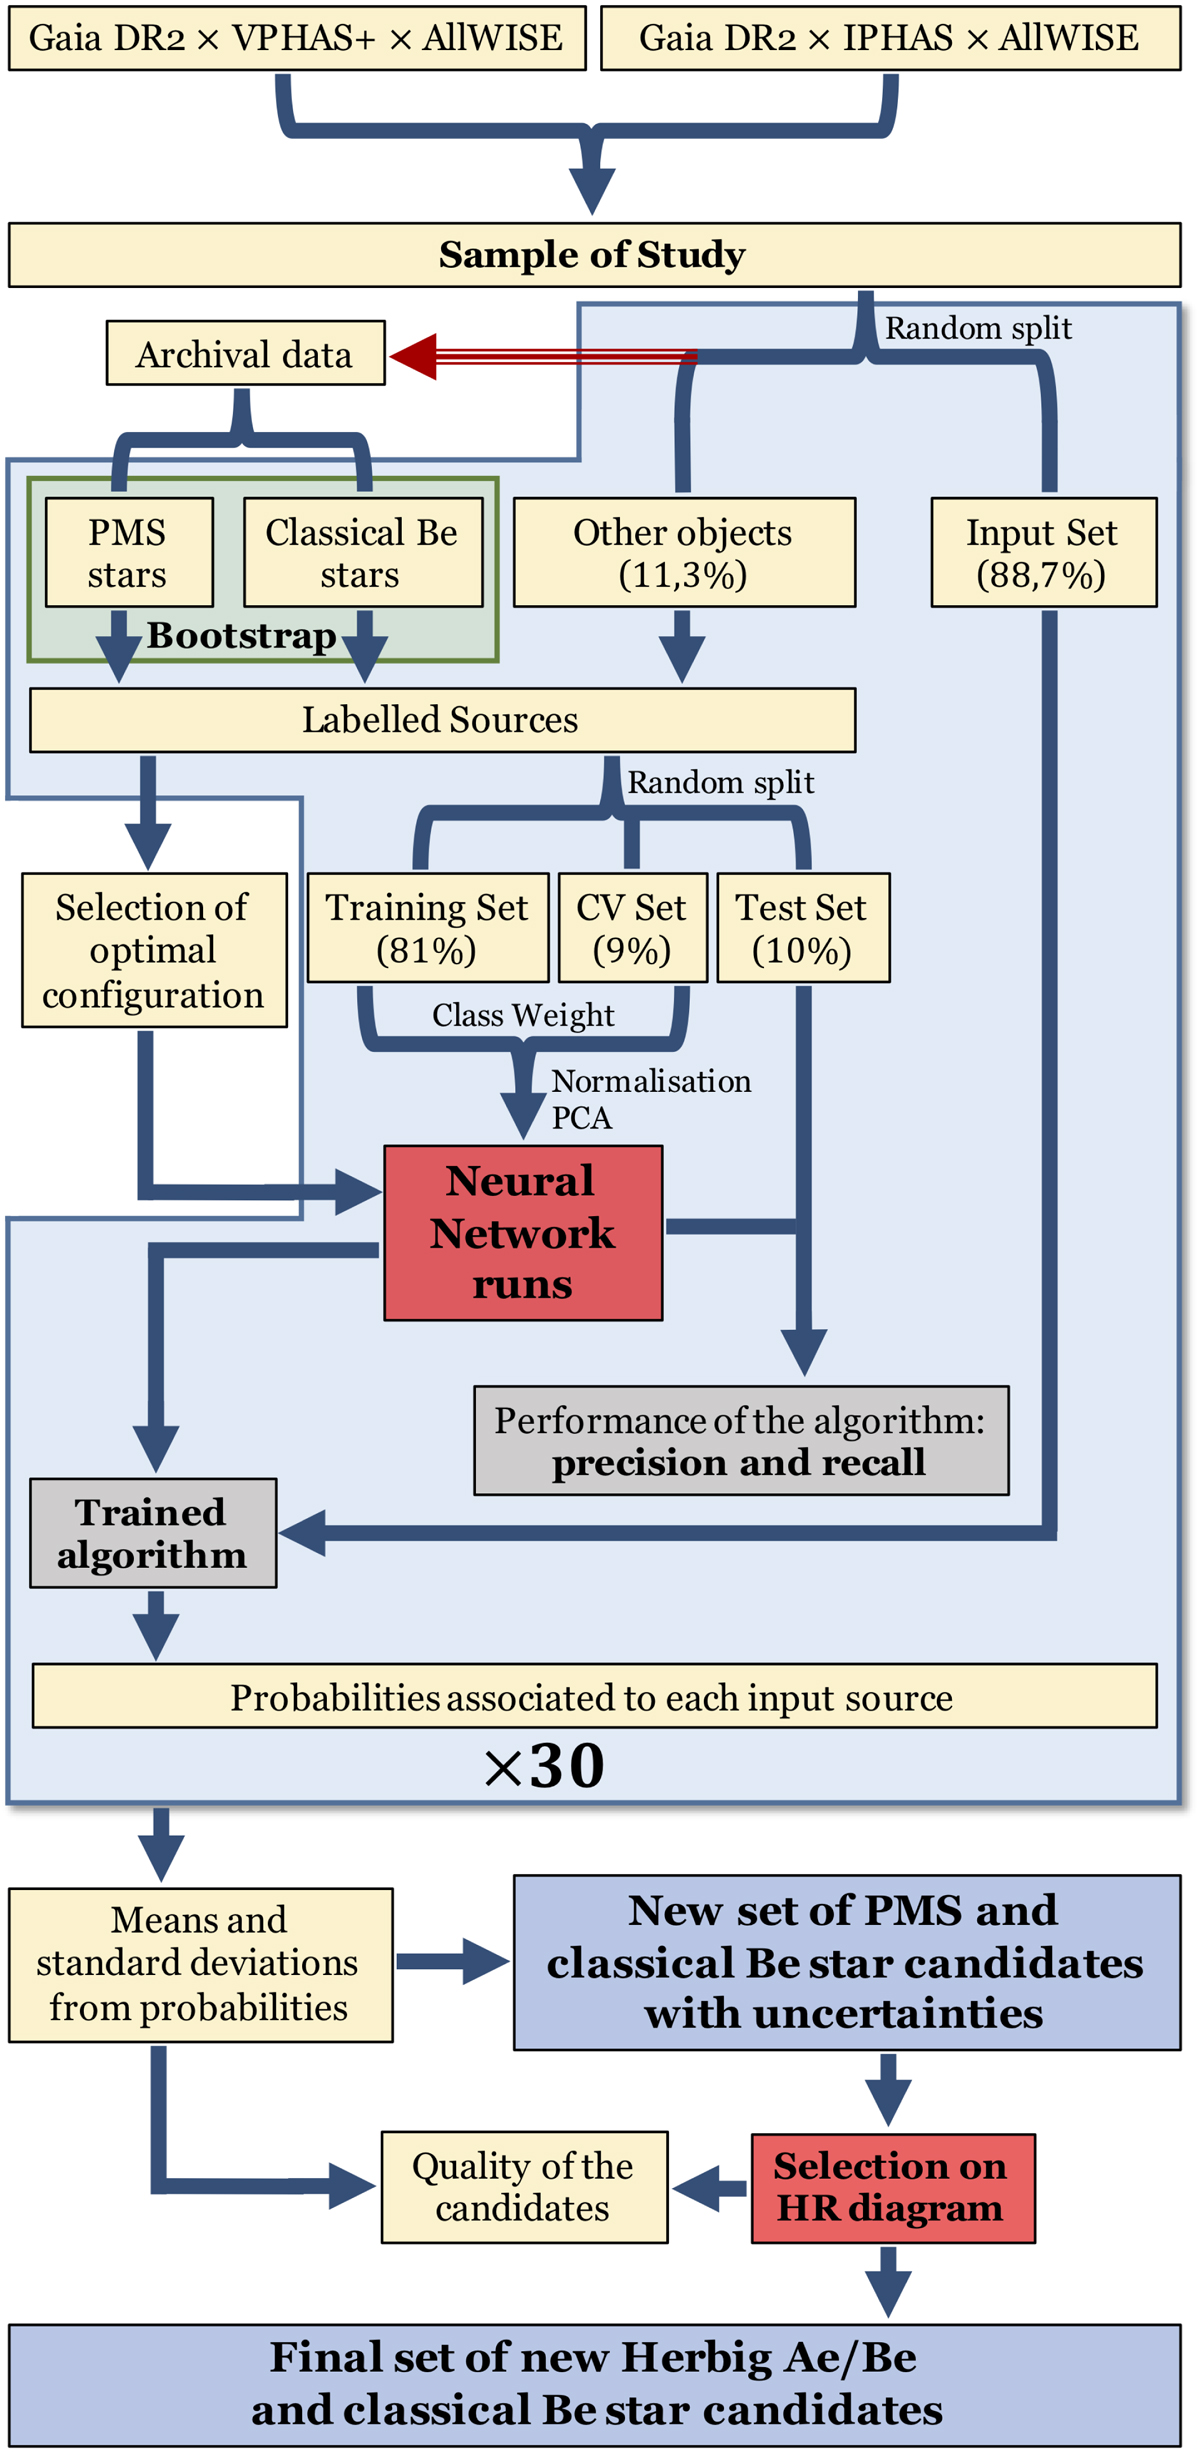
Pipeline of the whole algorithm, from the cross-match of Gaia DR2, AllWISE, IPHAS, and VPHAS+ to the set of new HAeBes and classical Be stars. The light blue area indicates the set of processes that are repeated in a loop 30 times, each time generating a different set of probabilities associated to each input source. The green area shows the bootstrapped sets. The red arrow indicates that the Archival data is partially contained within the Sample of Study, but was also constructed using external information like the Hα EWs.
Current usage metrics show cumulative count of Article Views (full-text article views including HTML views, PDF and ePub downloads, according to the available data) and Abstracts Views on Vision4Press platform.
Data correspond to usage on the plateform after 2015. The current usage metrics is available 48-96 hours after online publication and is updated daily on week days.
Initial download of the metrics may take a while.