Table 1.
Percentiles of the flux distribution: empirical flux density percentiles of the light curve for the two measured polarizations.
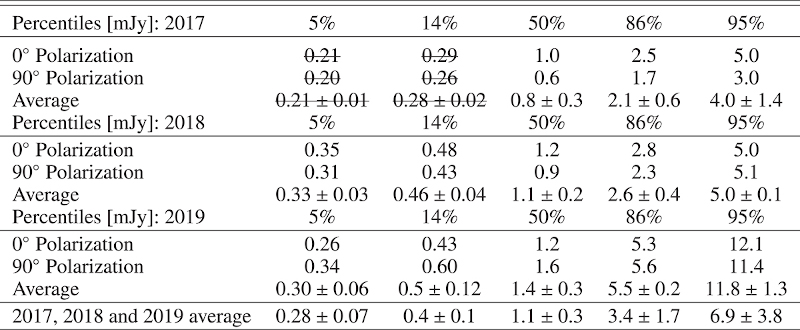
Notes. The averages reported are the mean of the polarization, the error is computed from the difference of the polarizations. The 5% and 14% quantiles of 2017 are affected by instrument systematics and thus are given only for completeness. We note that the polarization angle is with respect to the instrument and is not de-rotated to reflect the on-sky polarization.
Current usage metrics show cumulative count of Article Views (full-text article views including HTML views, PDF and ePub downloads, according to the available data) and Abstracts Views on Vision4Press platform.
Data correspond to usage on the plateform after 2015. The current usage metrics is available 48-96 hours after online publication and is updated daily on week days.
Initial download of the metrics may take a while.