Fig. 7.
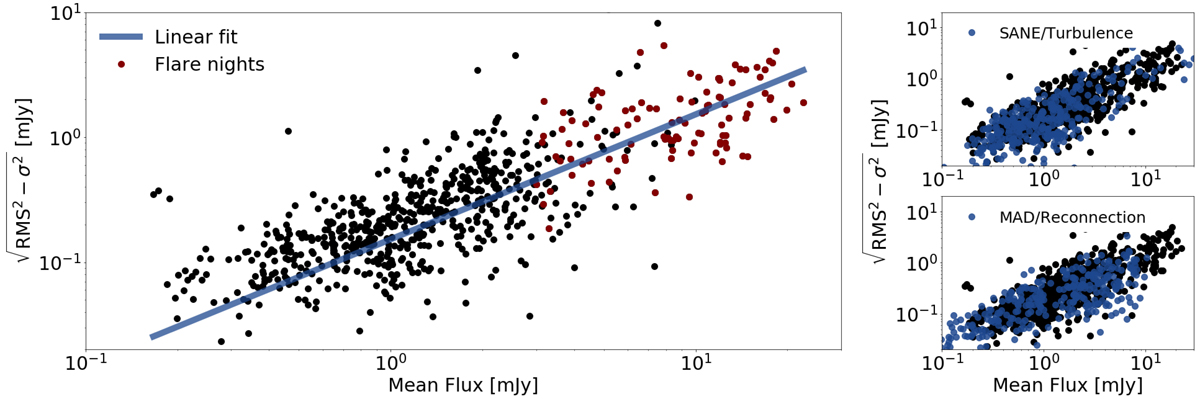
Left: rms–flux relation of Sgr A*: The rms variability of five minute segments of the light curve as a function of the mean flux density in the time bin. The light curve has a data point every 40 s, the rms is computed in the time domain and corrected for the measurement noise σ. The red points show the relation for mean flux densities above 3 mJy for the six nights with bright flares. The dark blue line is a linear fit, where the rms values have been weighted using the noise flux density relation determined in Sect. 2.3. This accounts for the increasing noise at higher flux densities. Right: comparison of the observed rms–flux relation to the relation computed from two GRMHD simulations presented in Dexter et al. (2020). The top plot compares the observed relation (black points) to a simulation with a SANE disk (gas pressure dominated) in which electron heating is achieved through a turbulence-like description (dark blue points); bottom plot compares the observations (black points) to MAD disk simulation (dynamically important magnetic fields) in which electron heating is achieved through magnetic-reconnection-like description (dark blue points).
Current usage metrics show cumulative count of Article Views (full-text article views including HTML views, PDF and ePub downloads, according to the available data) and Abstracts Views on Vision4Press platform.
Data correspond to usage on the plateform after 2015. The current usage metrics is available 48-96 hours after online publication and is updated daily on week days.
Initial download of the metrics may take a while.