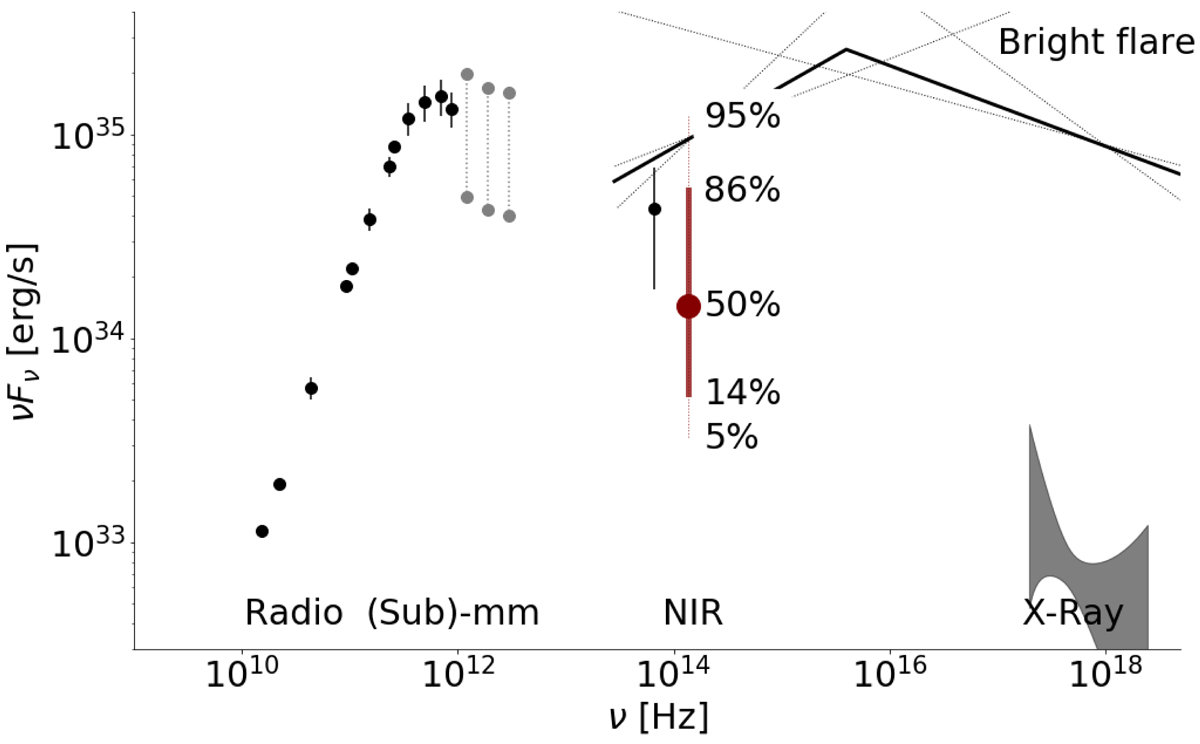
Fig. 4.

SED of Sgr A*: the radio and sub-mm data are from Falcke et al. (1998), Bower et al. (2015, 2019), Brinkerink et al. (2015), Liu et al. (2016). The far infrared data is from Stone et al. (2016) and von Fellenberg et al. (2018). The NIR M-band data is the median flux density inferred from the lognormal model of Witzel et al. (2018). The NIR K-band data is the GRAVITY flux density: the thick point is the median flux density, and further flux density percentiles are annotated. Also shown are the NIR and X-ray flux density spectrum of a bright simultaneous flare observed by Ponti et al. (2017), the quiescent X-ray flux density is determined from Baganoff et al. (2003).
Current usage metrics show cumulative count of Article Views (full-text article views including HTML views, PDF and ePub downloads, according to the available data) and Abstracts Views on Vision4Press platform.
Data correspond to usage on the plateform after 2015. The current usage metrics is available 48-96 hours after online publication and is updated daily on week days.
Initial download of the metrics may take a while.


