Fig. 5.
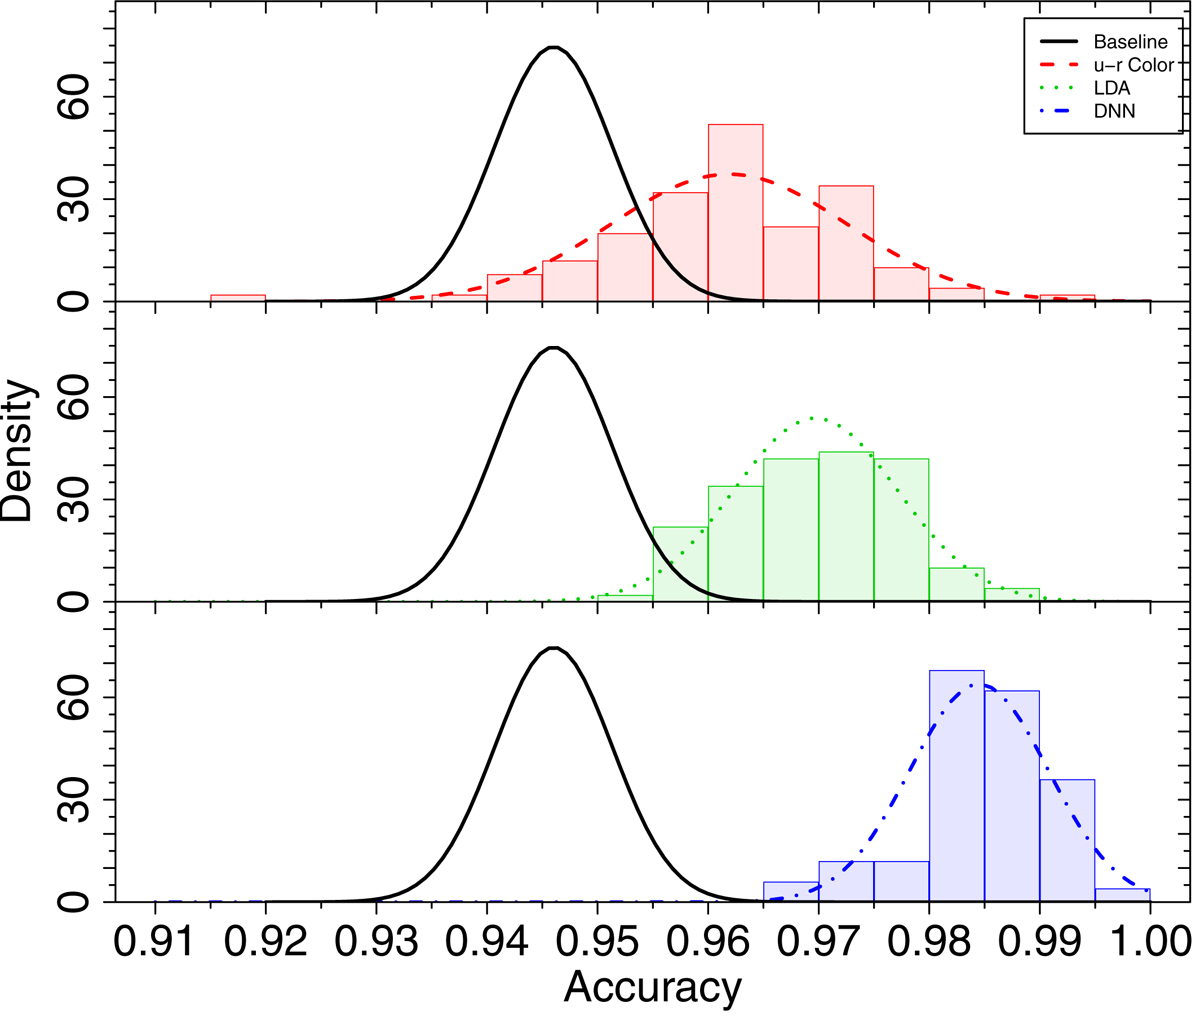
Histogram of accuracies for 100 galaxy classification bootstrap runs for the OTELO SP sample. The solid black lines correspond to the baseline accuracy distribution of the whole sample of 1834 OTELO SP galaxies. The red histogram and the Gaussian fit represented by a dashed line show the u − r color accuracy distribution obtained from 100 bootstrap runs. As for the u − r color, the green histogram and the dotted line show the LDA accuracy distribution. Similarly, the blue histogram and the dash-dotted line shows the DNN accuracy distribution.
Current usage metrics show cumulative count of Article Views (full-text article views including HTML views, PDF and ePub downloads, according to the available data) and Abstracts Views on Vision4Press platform.
Data correspond to usage on the plateform after 2015. The current usage metrics is available 48-96 hours after online publication and is updated daily on week days.
Initial download of the metrics may take a while.