Fig. 8.
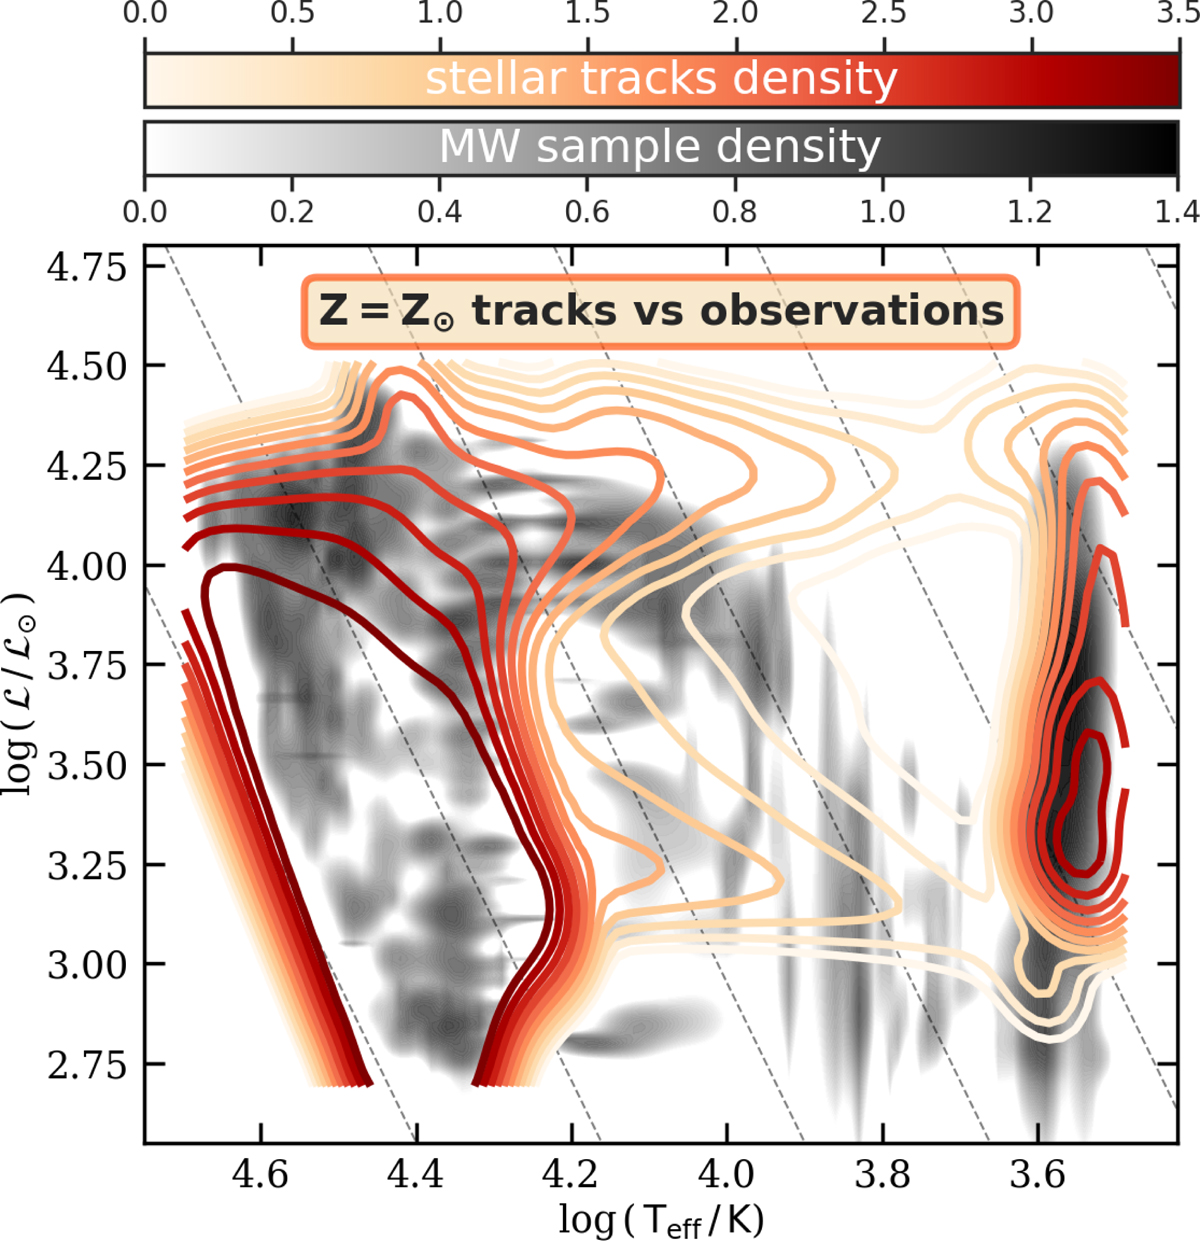
Comparison of our stellar tracks computed at solar metallicity with the observed sample of Galactic massive stars collected by Castro et al. (2014). The observations are plotted as a density map in a logarithmic grayscale. We overplot contours of the theoretical distribution of stars obtained from our reference model at Z = Z⊙ in color (also in a logarithmic scaling). The lack of observed stars in the parameter range of 3.7 ≲ log(Teff/K)≲3.9 and 3.5 ≲ log(ℒ/ℒ⊙) ≲ 4.0 is a tentative piece of evidence that solar metallicity massive stars (mass range of about 16–40 M⊙) expand until the red giant branch during the HG phase.
Current usage metrics show cumulative count of Article Views (full-text article views including HTML views, PDF and ePub downloads, according to the available data) and Abstracts Views on Vision4Press platform.
Data correspond to usage on the plateform after 2015. The current usage metrics is available 48-96 hours after online publication and is updated daily on week days.
Initial download of the metrics may take a while.