Fig. 1.
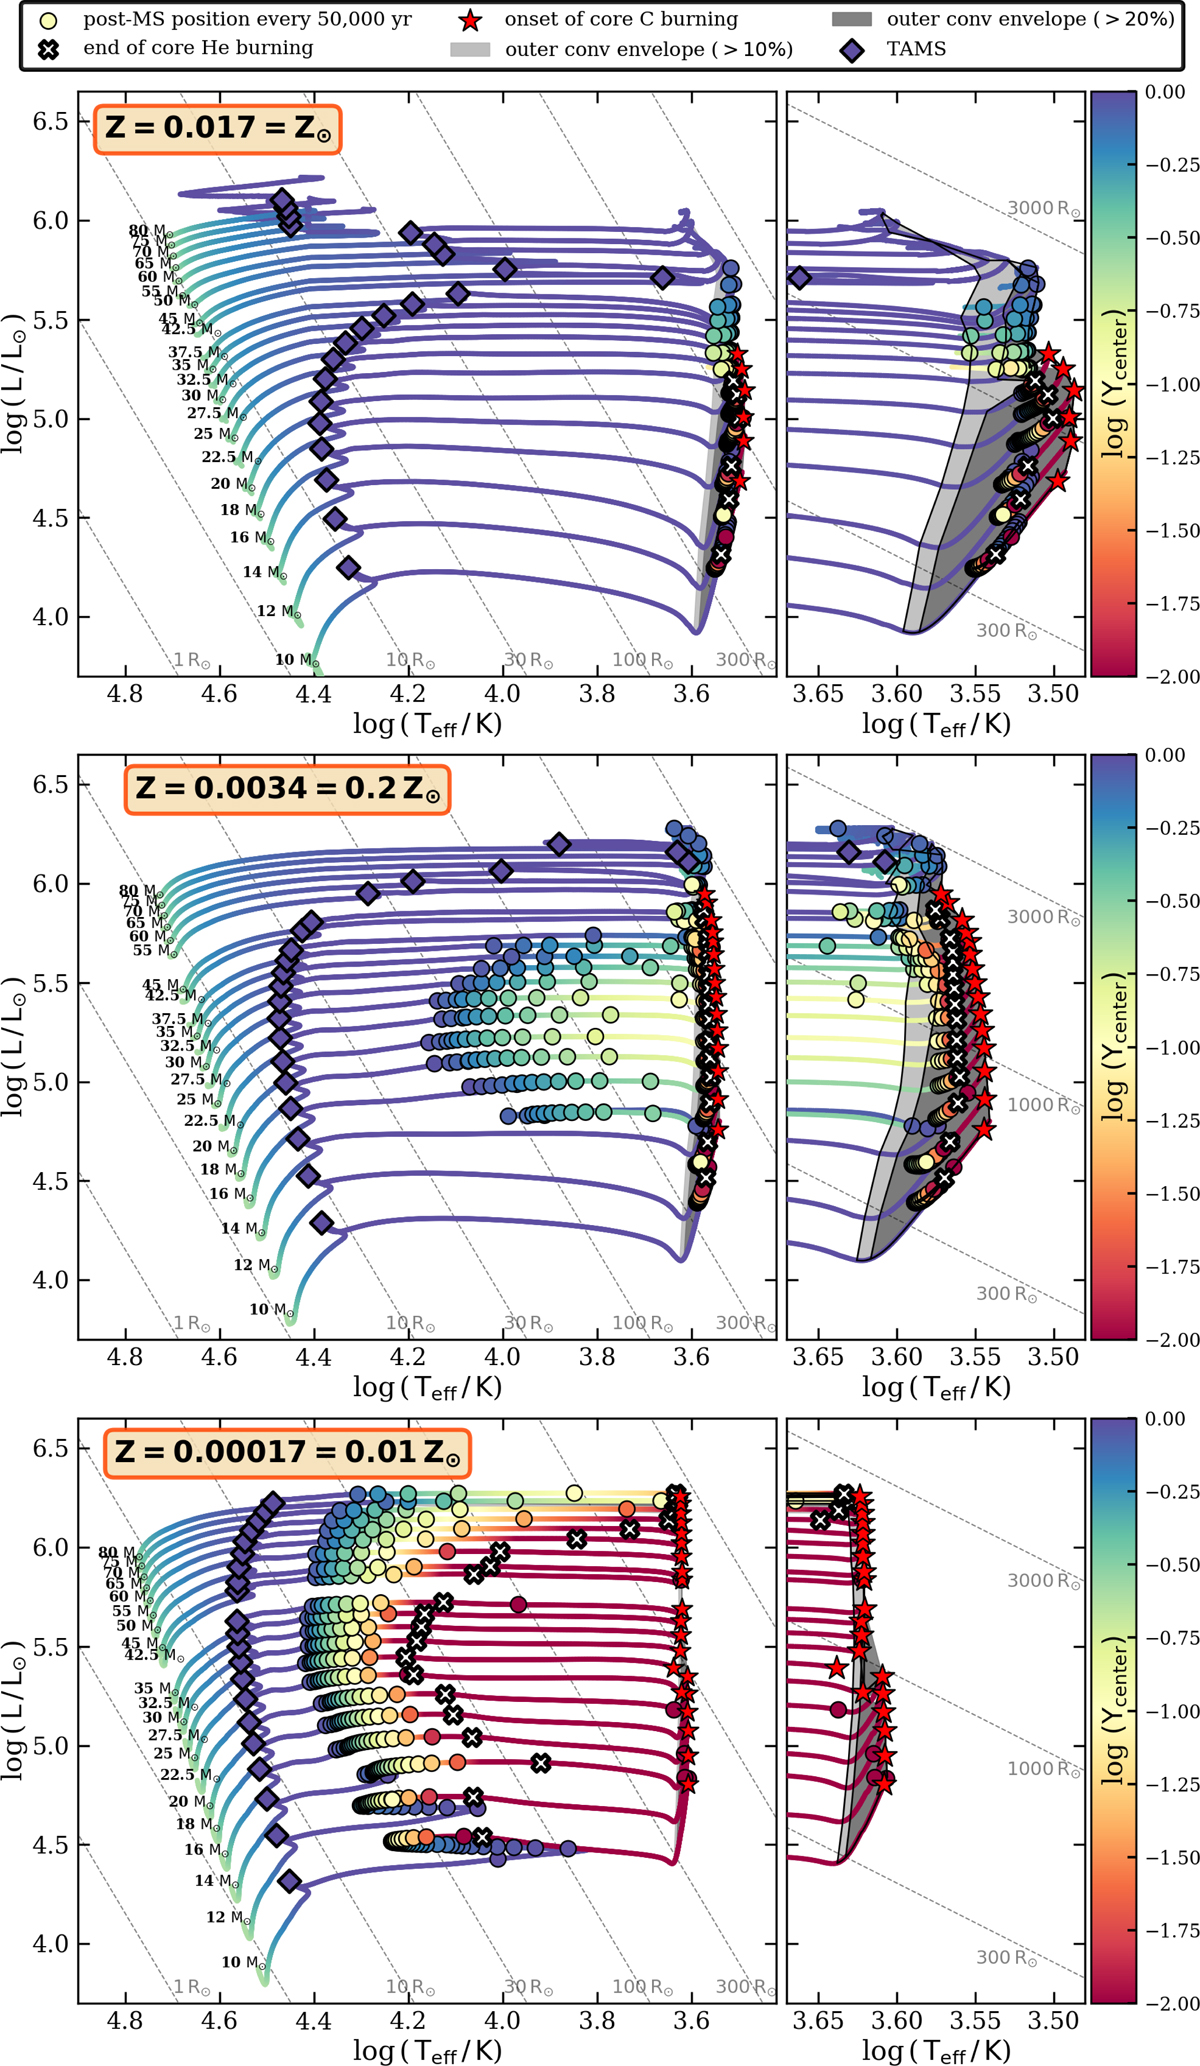
Evolutionary tracks of single stars of masses between 10 and 80 M⊙ computed at three different metallicities: solar (top), SMC-like (middle), and very low metallicity Z = 0.01 Z⊙ (bottom). See Fig. C.1 for tracks at three additional metallicities. Filled circles mark the position of a star during its post-MS evolution taken every 50 000 years. Color indicates the central helium abundance (YC, in logarithmic scale). With a cross we mark the end of core-helium burning (YC < 10−3), and with a red star we mark the onset of core-carbon burning (![]() ). Shaded regions mark stars with outer convective envelope layers of at least 10% (or 20%) of the mass of the entire star. For tracks that turn around towards the hotter part of the HR diagram (and the WR regime) because of extensive mass loss, we only show the evolution until shortly after the maximum radius has been reached.
). Shaded regions mark stars with outer convective envelope layers of at least 10% (or 20%) of the mass of the entire star. For tracks that turn around towards the hotter part of the HR diagram (and the WR regime) because of extensive mass loss, we only show the evolution until shortly after the maximum radius has been reached.
Current usage metrics show cumulative count of Article Views (full-text article views including HTML views, PDF and ePub downloads, according to the available data) and Abstracts Views on Vision4Press platform.
Data correspond to usage on the plateform after 2015. The current usage metrics is available 48-96 hours after online publication and is updated daily on week days.
Initial download of the metrics may take a while.