Fig. 1.
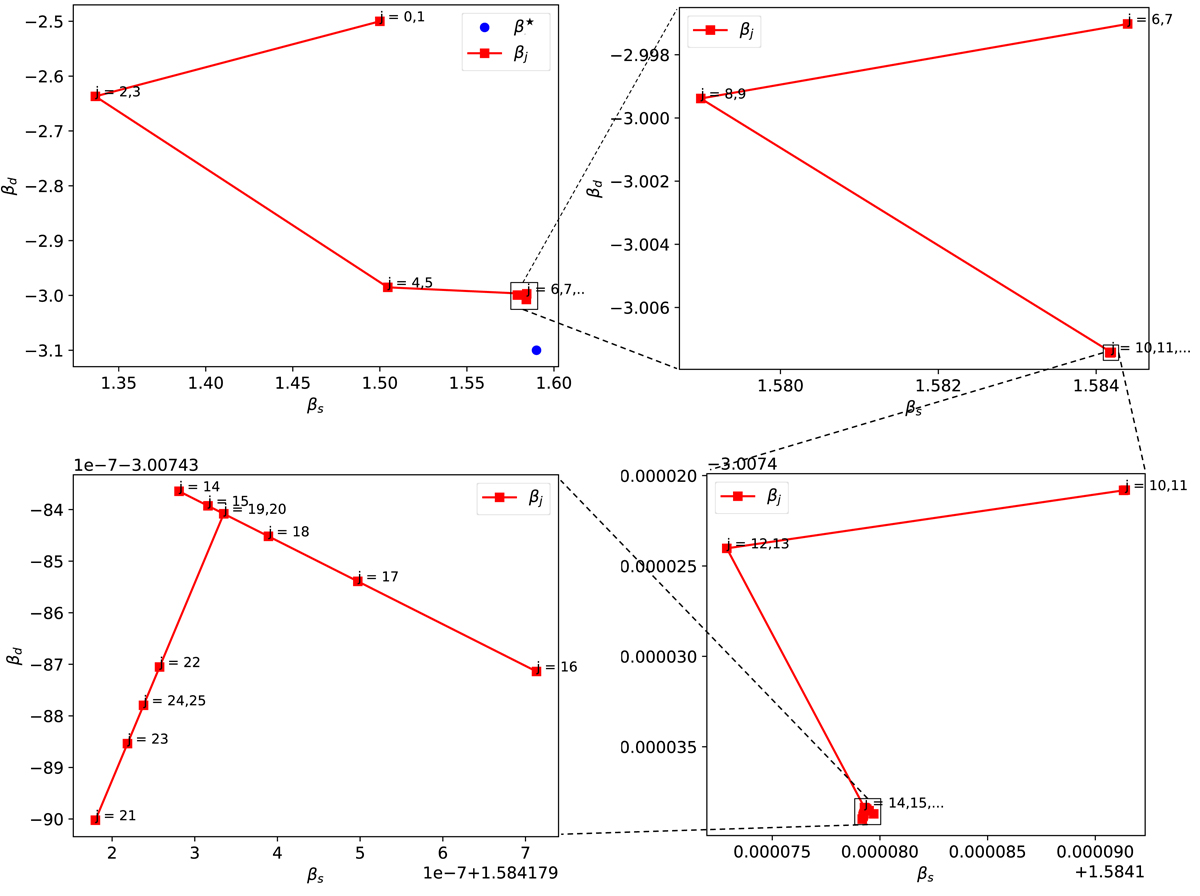
Sequence of the spectral parameters βi = [βi, s, βi, d] used in our experiments and derived from the maximization of the spectral likelihood, Eq. (16). The panels in clockwise order show consecutive zooms on the sequence that converged on the likelihood peak values of β = [− 3.006, 1.584], slightly off the true values marked by the blue solid point in the top left panel and given by Eq. (45) (with Td fixed in our test cases). The sequence was generated as described at the end of Sect. 4.1.2.
Current usage metrics show cumulative count of Article Views (full-text article views including HTML views, PDF and ePub downloads, according to the available data) and Abstracts Views on Vision4Press platform.
Data correspond to usage on the plateform after 2015. The current usage metrics is available 48-96 hours after online publication and is updated daily on week days.
Initial download of the metrics may take a while.