Free Access
Fig. 8
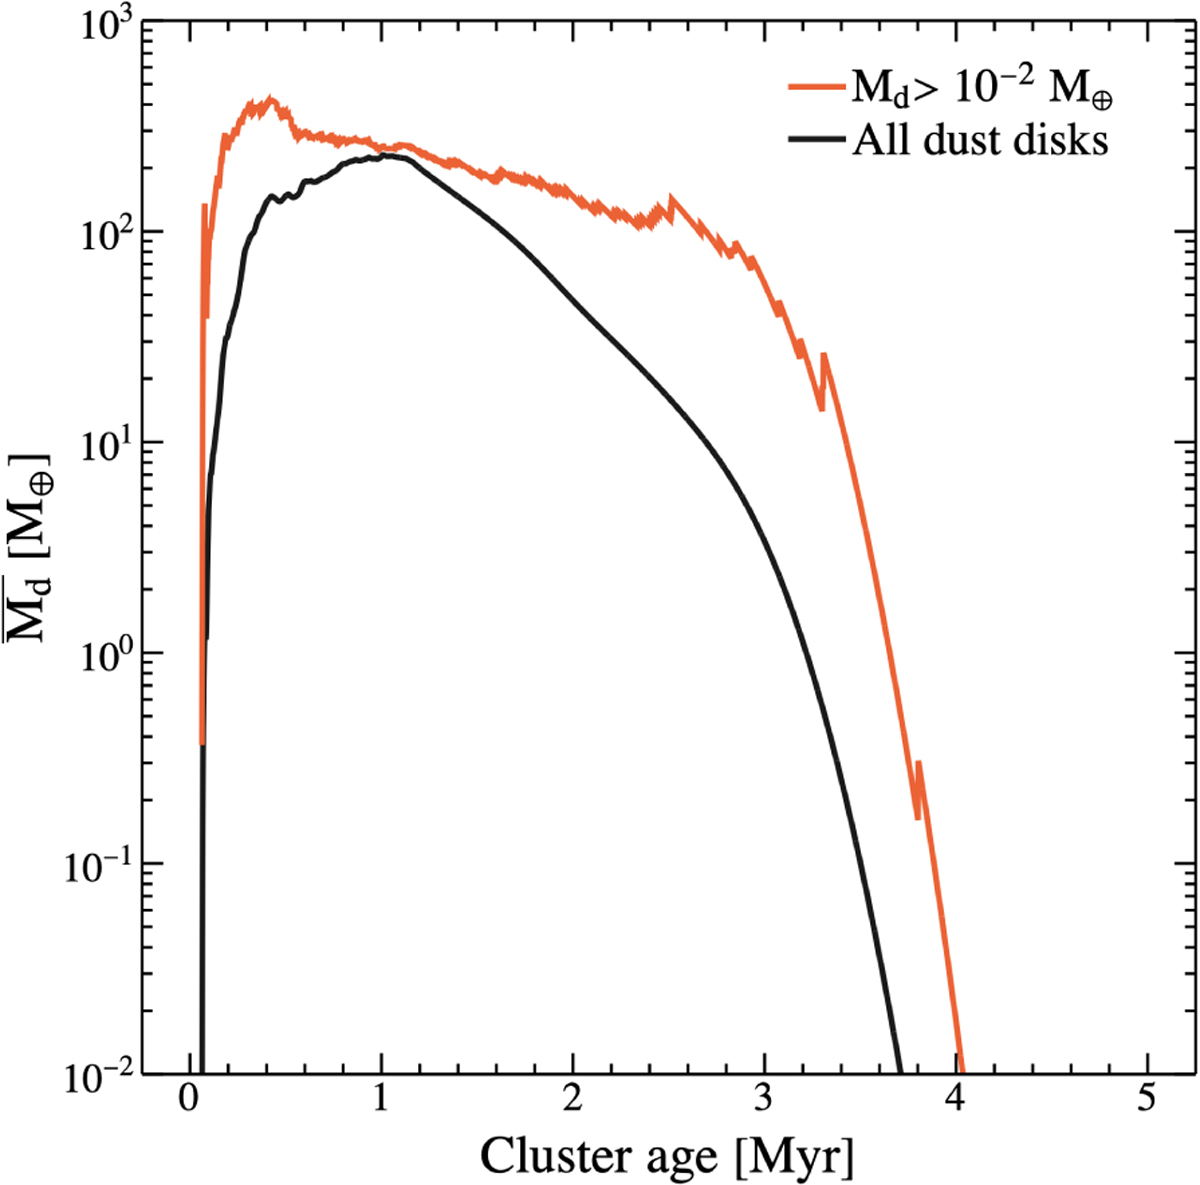
Mean dust disc mass as a function of cluster age. The black curve shows the mean mass when including all dust discs and the red curve shows the mean mass when dust discs with masses < 10−2 M⊕ are excluded.
Current usage metrics show cumulative count of Article Views (full-text article views including HTML views, PDF and ePub downloads, according to the available data) and Abstracts Views on Vision4Press platform.
Data correspond to usage on the plateform after 2015. The current usage metrics is available 48-96 hours after online publication and is updated daily on week days.
Initial download of the metrics may take a while.