Fig. 2
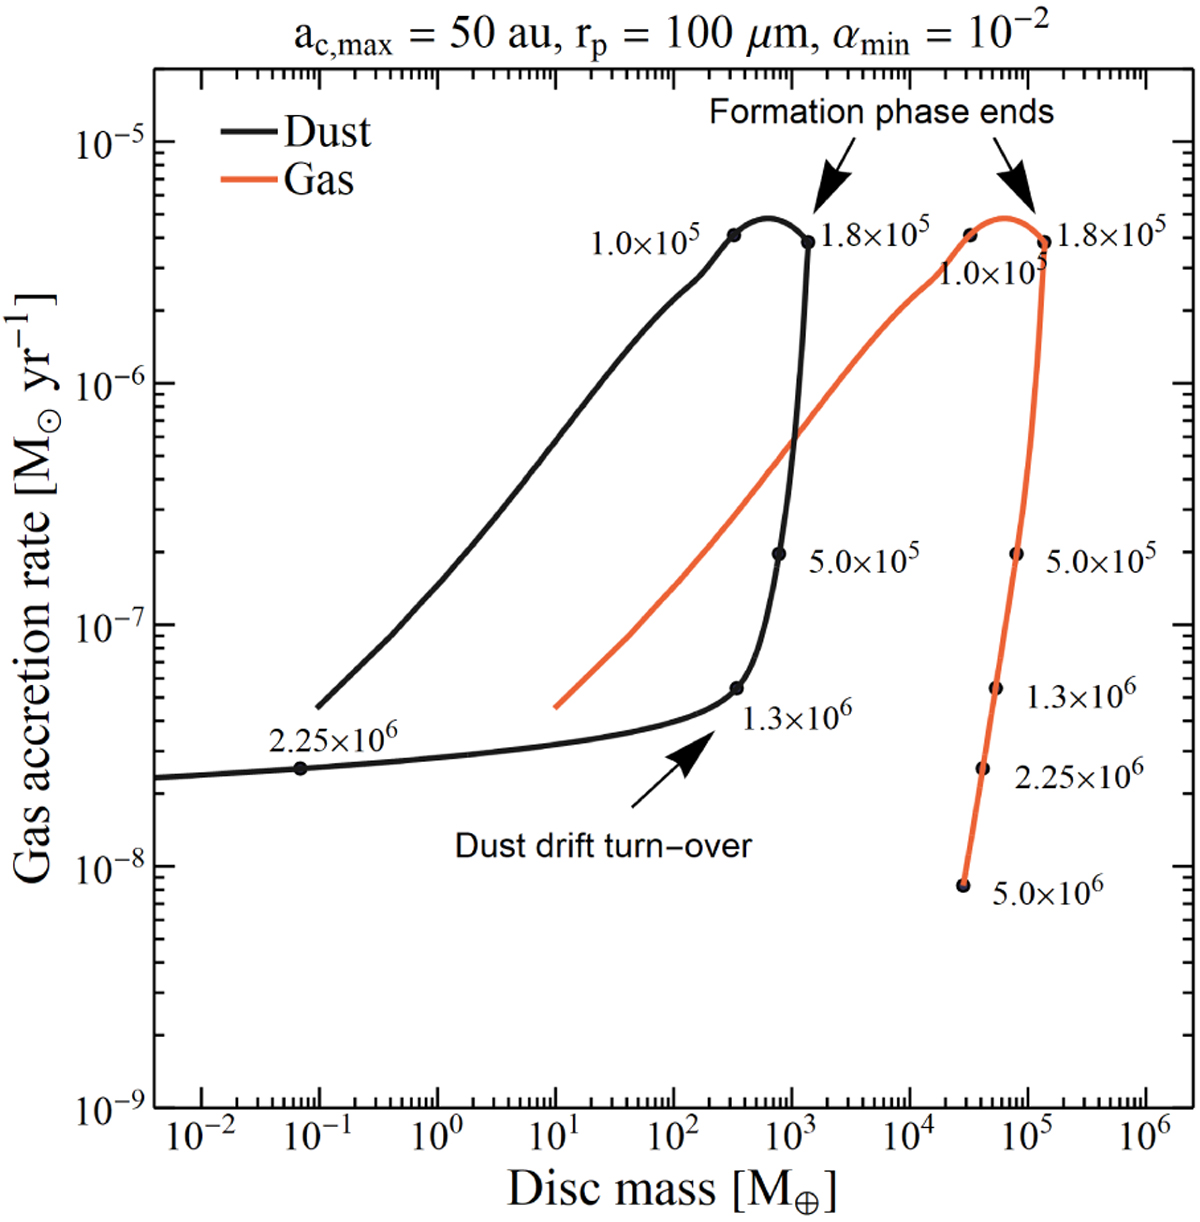
Stellar gas accretion rate as a function of disc mass for the reference case. The black curve shows the dust disc mass and the red curve shows the gas disc mass. The black dots mark the age in years as labelled. There are three clear regimes in this relation. During the formation phase of the disc, the gas accretion rate and the disc dust mass are both increasing. Once the formation phase has ended, dust drift is slow and the gas accretion rate drops faster than the disc dust mass. Rapid draining of the dust disc mass begins around t ≈ 1.3 × 10⁶ and lasts about 1 Myr.
Current usage metrics show cumulative count of Article Views (full-text article views including HTML views, PDF and ePub downloads, according to the available data) and Abstracts Views on Vision4Press platform.
Data correspond to usage on the plateform after 2015. The current usage metrics is available 48-96 hours after online publication and is updated daily on week days.
Initial download of the metrics may take a while.