Free Access
Fig. C.2
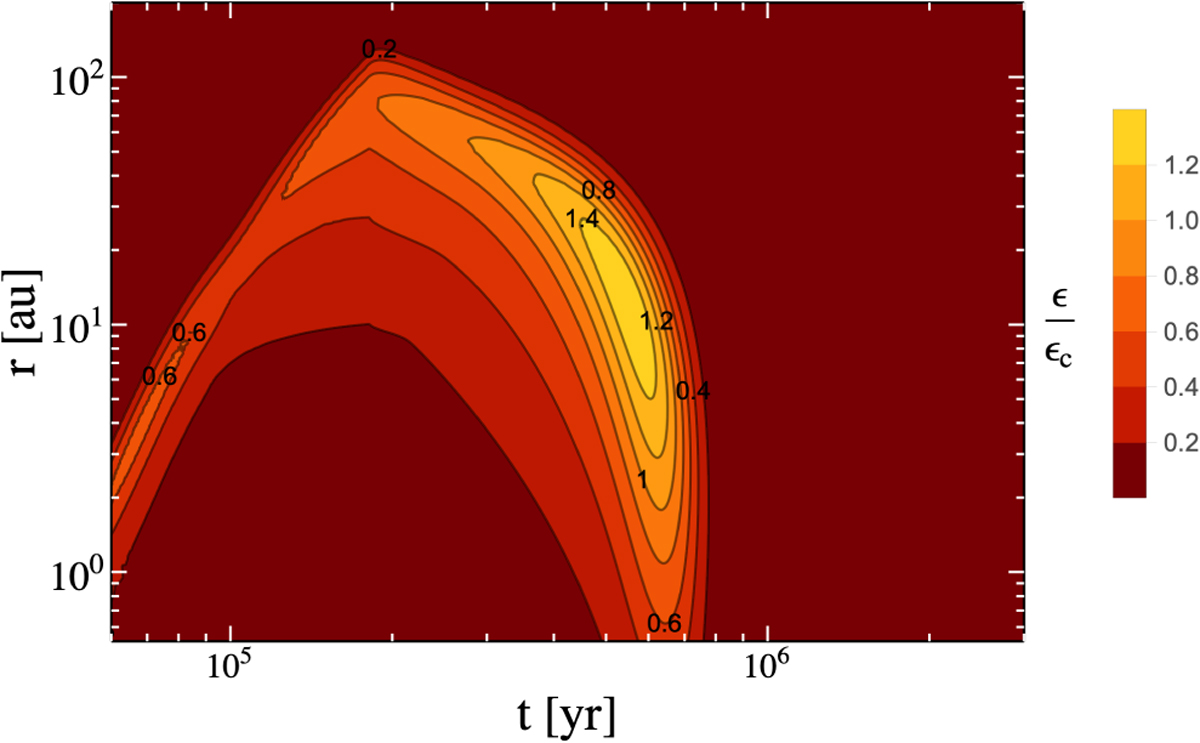
Contour plot of the ratio between the critical dust-to-gas ratio and the critical dust-to-gas ratio for the streaming instability. Using dust with a size of 1 mm the critical dust-to-gas ratio passed after ≈ 3 × 10⁵ yr. The super-critical region remains until t ≈ 7 × 10⁵ yr.
Current usage metrics show cumulative count of Article Views (full-text article views including HTML views, PDF and ePub downloads, according to the available data) and Abstracts Views on Vision4Press platform.
Data correspond to usage on the plateform after 2015. The current usage metrics is available 48-96 hours after online publication and is updated daily on week days.
Initial download of the metrics may take a while.