Fig. 12
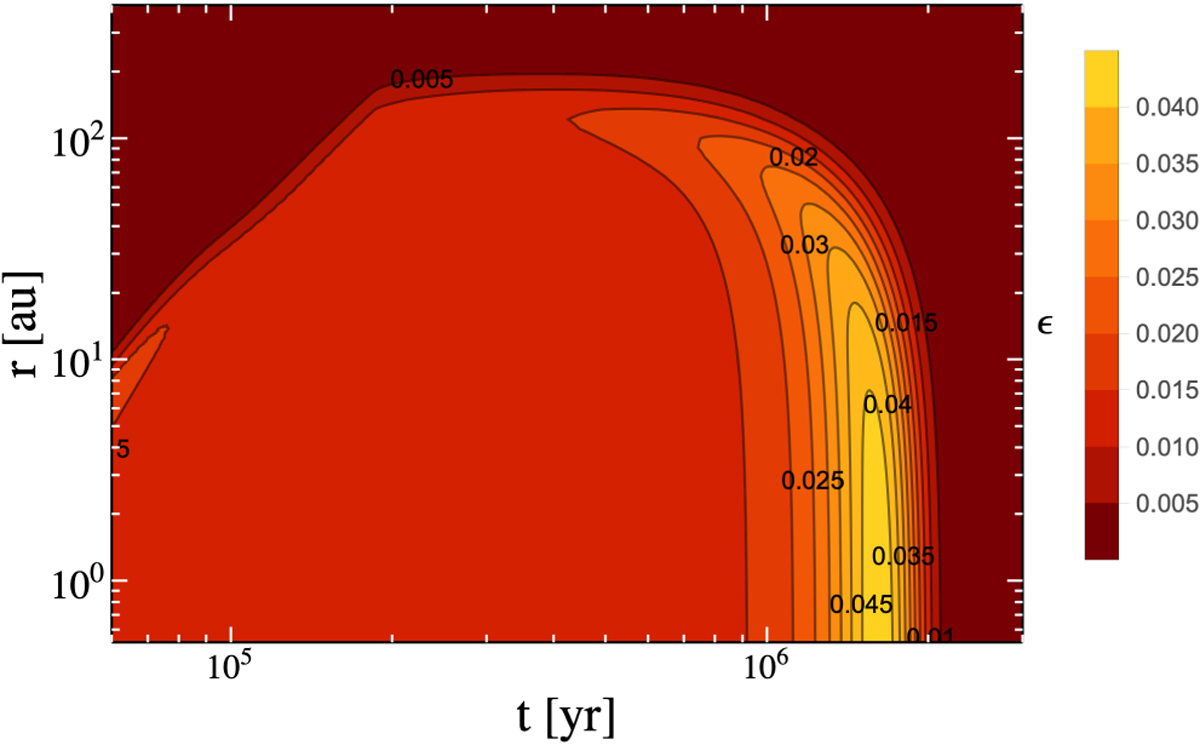
Contour plot of the dust-to-gas ratio over time and disc radius for the reference case. For the first ≈ 0.8 Myr the dust-to-gas ratio remains at the initial ISM value of 1/100. After this the dust-to-gas ratio begins to increase in the inner 100 au of the disc due to the pile up of dust caused by rapid radial dust drift. The increase is strongest in the inner ≈ 5 au. The pile up occurs because dust drift is faster in the outer parts of the disc compared to the inner parts.
Current usage metrics show cumulative count of Article Views (full-text article views including HTML views, PDF and ePub downloads, according to the available data) and Abstracts Views on Vision4Press platform.
Data correspond to usage on the plateform after 2015. The current usage metrics is available 48-96 hours after online publication and is updated daily on week days.
Initial download of the metrics may take a while.