Fig. 11
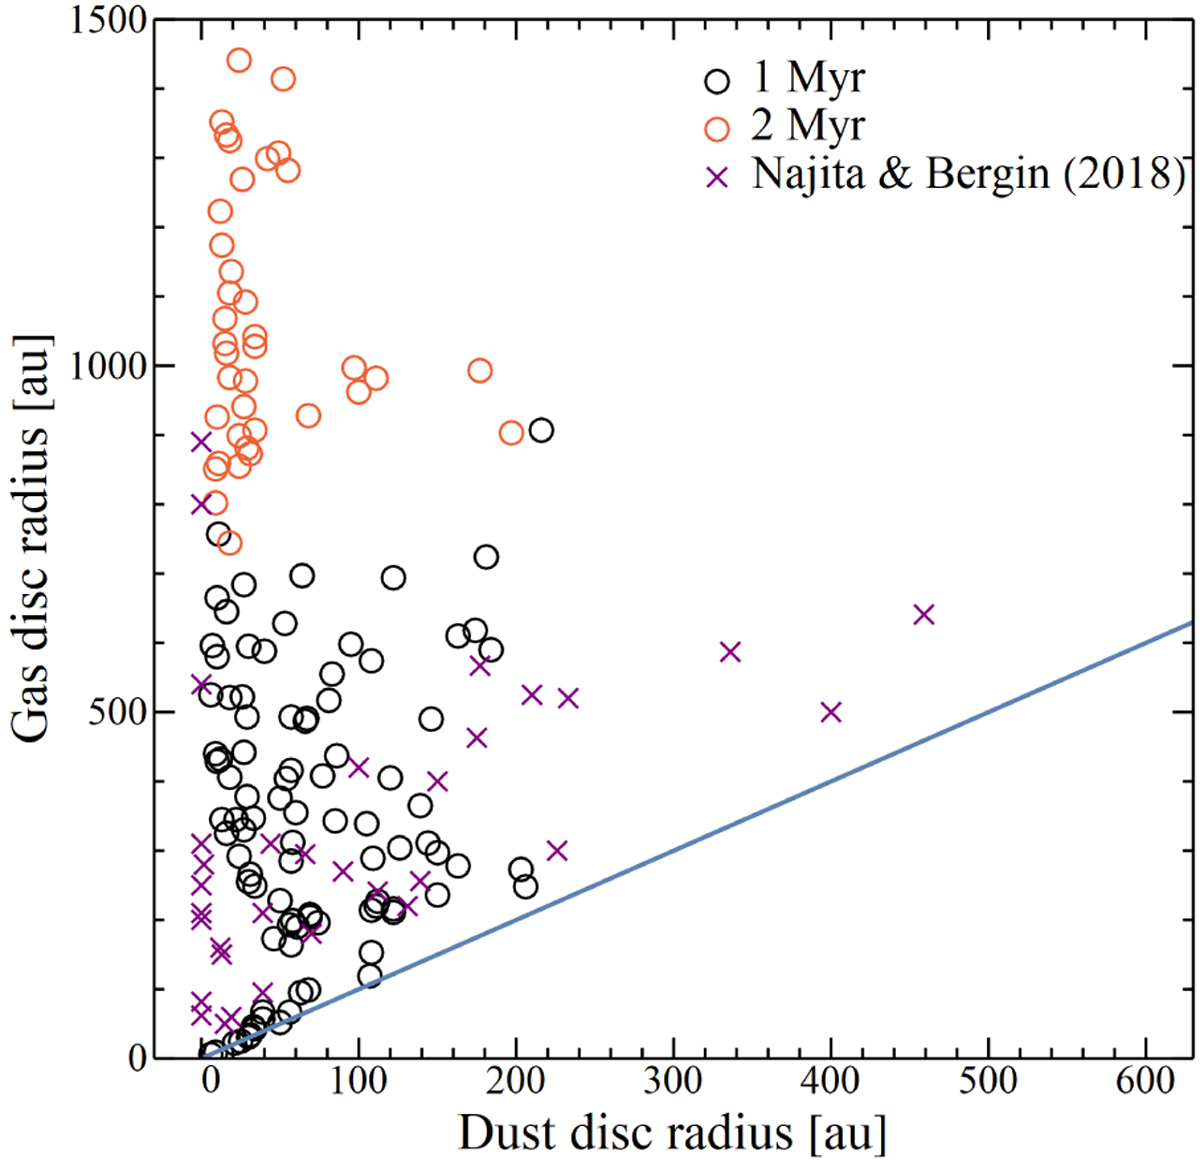
Gas disc radius as a function of dust disc radius for the cluster of discs at 1 Myr (black circles) and 2 Myr (red circles). The purple crosses are observational measurements taken from Najita & Bergin (2018). The blue line shows Rg = Rd. At 1 Myr our results agree well with observations, but at 2 Myr the gas disc radii that we find are a factor of two to three higherthan observations.
Current usage metrics show cumulative count of Article Views (full-text article views including HTML views, PDF and ePub downloads, according to the available data) and Abstracts Views on Vision4Press platform.
Data correspond to usage on the plateform after 2015. The current usage metrics is available 48-96 hours after online publication and is updated daily on week days.
Initial download of the metrics may take a while.