Fig. A.1.
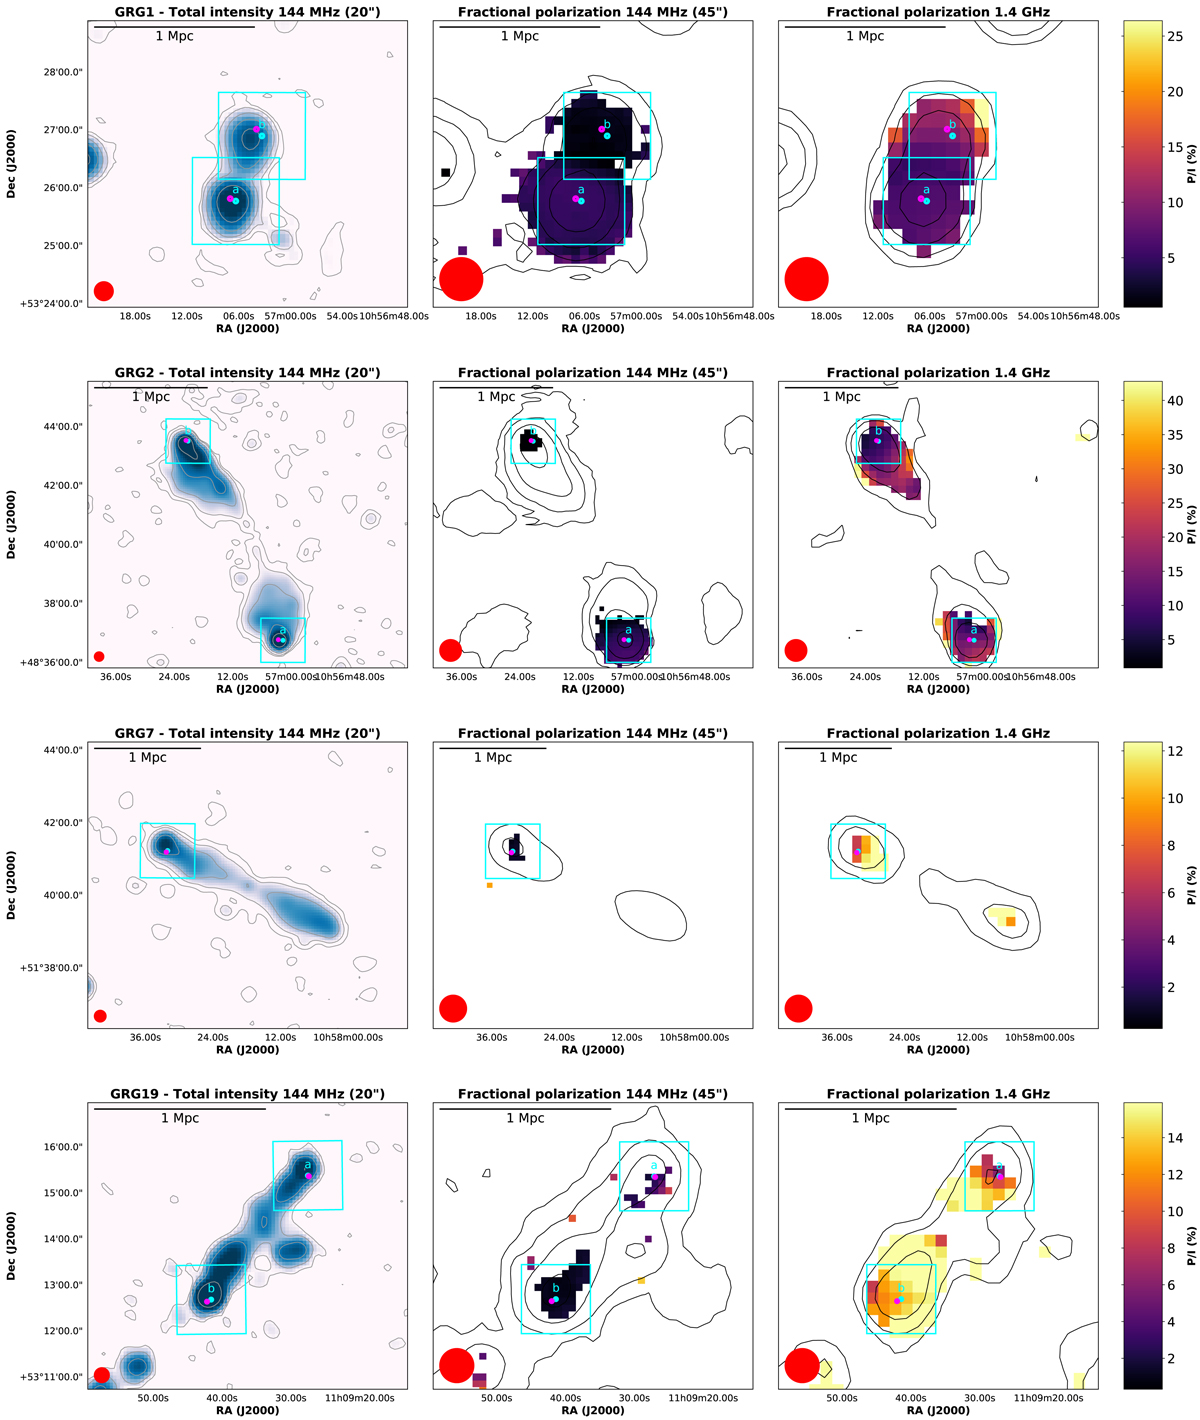
Images of the GRGs detected in polarization. Left: LoTSS total intensity image at 20″ resolution with contours overlaid. Contours start at 3σ noise level and are spaced by a factor of four (with σ ranging between 0.09 and 0.9 mJy beam−1). Center: LoTSS fractional polarization at 45″ resolution with total intensity contours overlaid. Contours start at 3σ noise level and are spaced by a factor of four (with σ ranging between 0.1 and 8 mJy beam−1). Only pixels above the 8σQU detection threshold in polarization are shown (except for GRG 78, for which the threshold is seven times σQU, and GRG 80 and GRG 87, for which it is 6σQU). Right: NVSS fractional polarization with total intensity contours overlaid. Contours start at 3σ noise level and are spaced by a factor of four (with σ ranging between 0.2 and 0.7 mJy beam−1). Only pixels with a signal-to-noise ratio higher than three in polarization are shown. The color scale and limits are the same in both P/I images for each source. The cyan squares mark the component detected at 20″, cyan points mark the peak of polarized intensity at 20″ (RM and fractional polarization values at this position are listed in Tables 2 and 3), while magenta points mark the position where we computed the depolarization factors. Letters mark the two components listed in Table 2 for double-lobed detected sources.
Current usage metrics show cumulative count of Article Views (full-text article views including HTML views, PDF and ePub downloads, according to the available data) and Abstracts Views on Vision4Press platform.
Data correspond to usage on the plateform after 2015. The current usage metrics is available 48-96 hours after online publication and is updated daily on week days.
Initial download of the metrics may take a while.