Fig. 7.
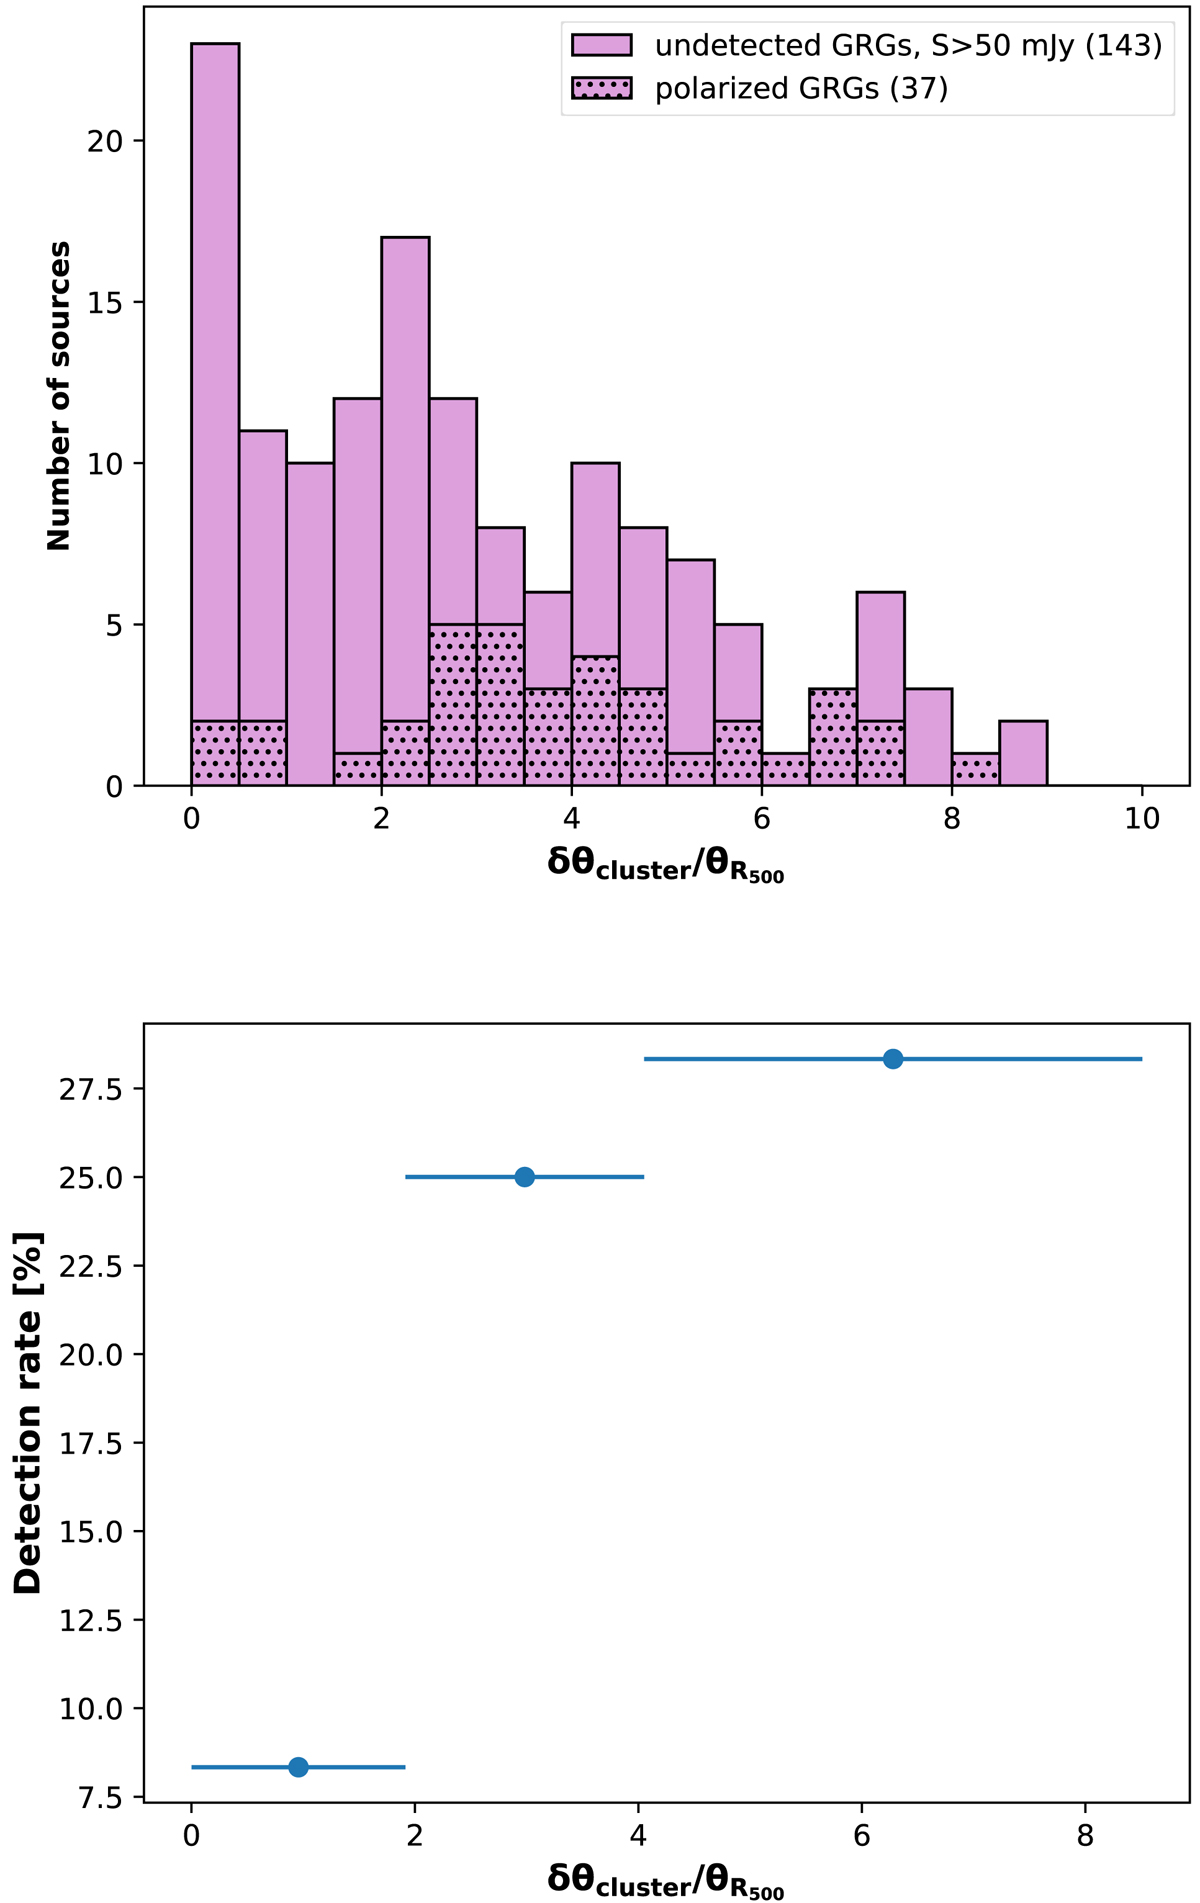
Distribution of minimum distance from the closest foreground cluster for detected and undetected sources in polarization (top panel), and detection rate as a function of the minimum distance from foreground clusters (bottom panel). The widths of the bins were computed to contain the same total number of sources (i.e., 60). Markers were positioned at the center of each bin and the error bars show the width of the bins.
Current usage metrics show cumulative count of Article Views (full-text article views including HTML views, PDF and ePub downloads, according to the available data) and Abstracts Views on Vision4Press platform.
Data correspond to usage on the plateform after 2015. The current usage metrics is available 48-96 hours after online publication and is updated daily on week days.
Initial download of the metrics may take a while.