Fig. 5.
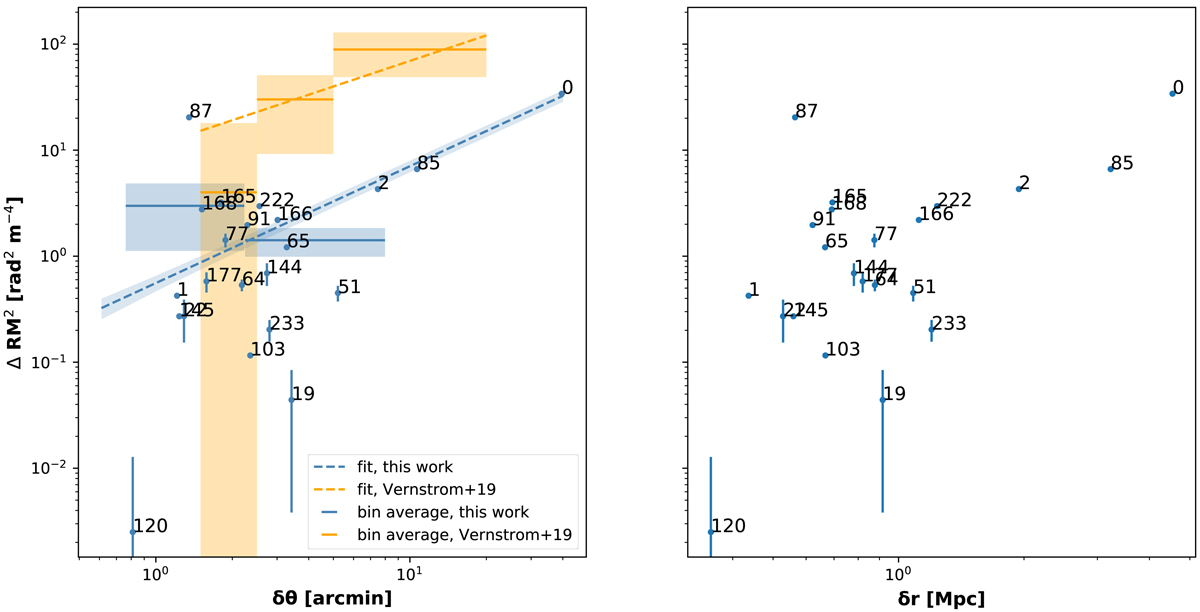
Squared RM difference versus angular (left) and physical (right) separation between the detected lobes. A number corresponds to each GRG and the numbers are listed in Table 2. The blue dashed line is the power-law fit to the data with 1σ uncertainty (see Sect. 3.1). Orange bars show the binned averages between 1.5′ and 20′ obtained by Vernstrom et al. (2019) for physical pairs observed at 1.4 GHz and the dashed orange line shows the derived structure function. Blue bars show the binned averages of the sources in this work with an angular separation lower than 10′: Each bin contains ten sources, the uncertainty was computed as the standard deviation on the mean. Shadowed areas show the uncertainties.
Current usage metrics show cumulative count of Article Views (full-text article views including HTML views, PDF and ePub downloads, according to the available data) and Abstracts Views on Vision4Press platform.
Data correspond to usage on the plateform after 2015. The current usage metrics is available 48-96 hours after online publication and is updated daily on week days.
Initial download of the metrics may take a while.