Fig. 1.
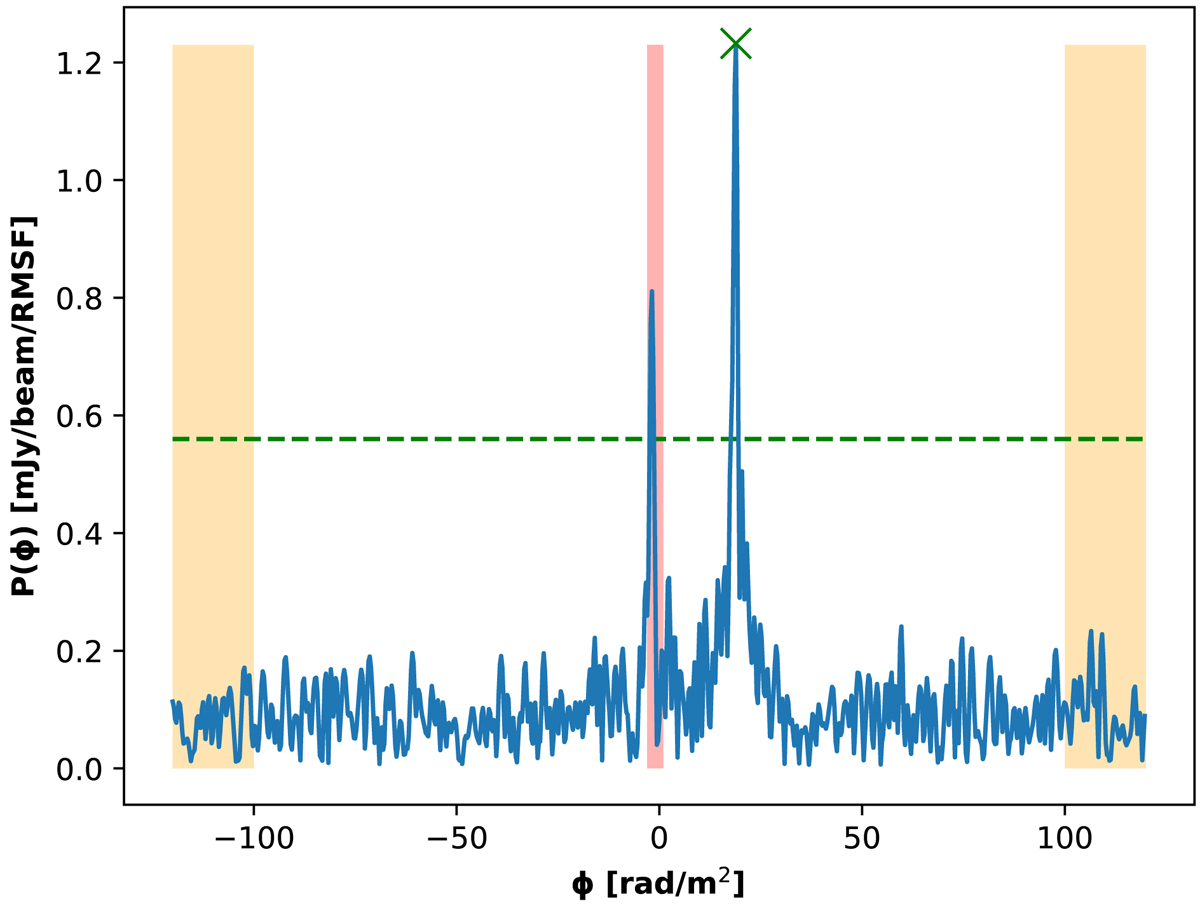
Example Faraday spectrum. In particular, this is the Faraday spectrum obtained at the polarized peak position of the lobe “b” of GRG 2 (see Table 2). The red shadowed area shows the region of the spectrum excluded due to the instrumental leakage contamination. The orange areas show the range used to compute the root mean square noise from the Q and U Faraday spectra. The green dashed line highlights the 8σ detection threshold. The green “X” marks the position of the peak from which we derived the RM and P values of the pixel.
Current usage metrics show cumulative count of Article Views (full-text article views including HTML views, PDF and ePub downloads, according to the available data) and Abstracts Views on Vision4Press platform.
Data correspond to usage on the plateform after 2015. The current usage metrics is available 48-96 hours after online publication and is updated daily on week days.
Initial download of the metrics may take a while.