Fig. 9
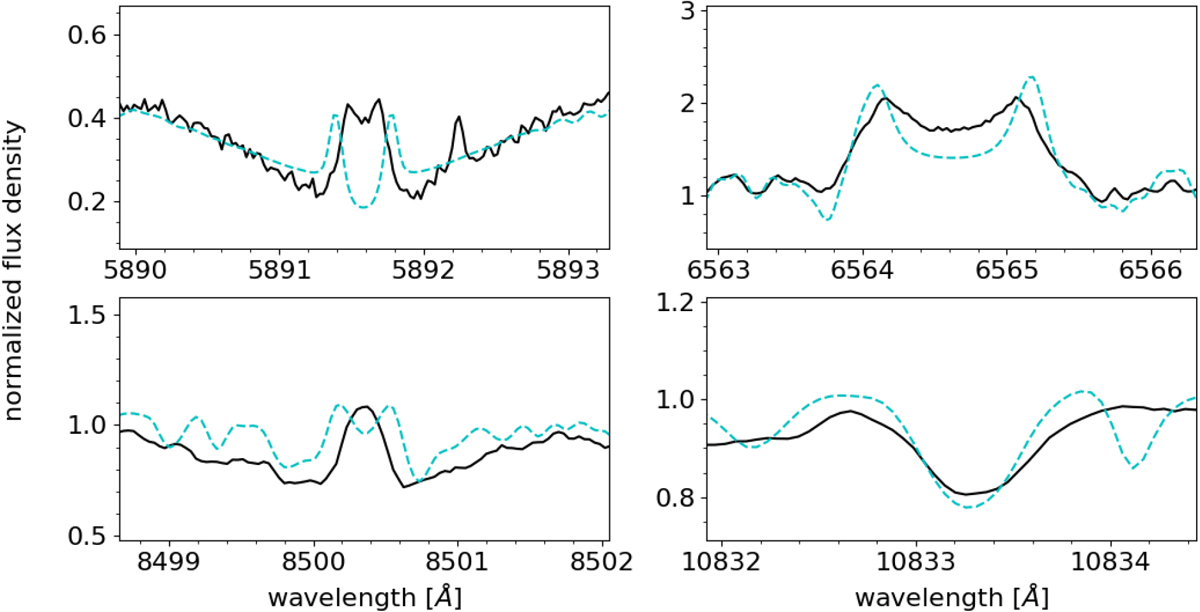
Comparison of the best linear combination fit (dashed cyan line, from Hintz et al. 2019) to an observed spectrum (solid black) TYC 3529-1437-1 optimized for the lines of Na I D2 (top left panel), Hα (top right panel), and the bluest Ca II IRT line (bottom left panel) and extended to the He I IR line (bottom right panel). The linear combination consists of 74.9% of inactive model 079 and 25.1% of active model 149.
Current usage metrics show cumulative count of Article Views (full-text article views including HTML views, PDF and ePub downloads, according to the available data) and Abstracts Views on Vision4Press platform.
Data correspond to usage on the plateform after 2015. The current usage metrics is available 48-96 hours after online publication and is updated daily on week days.
Initial download of the metrics may take a while.