Fig. 7
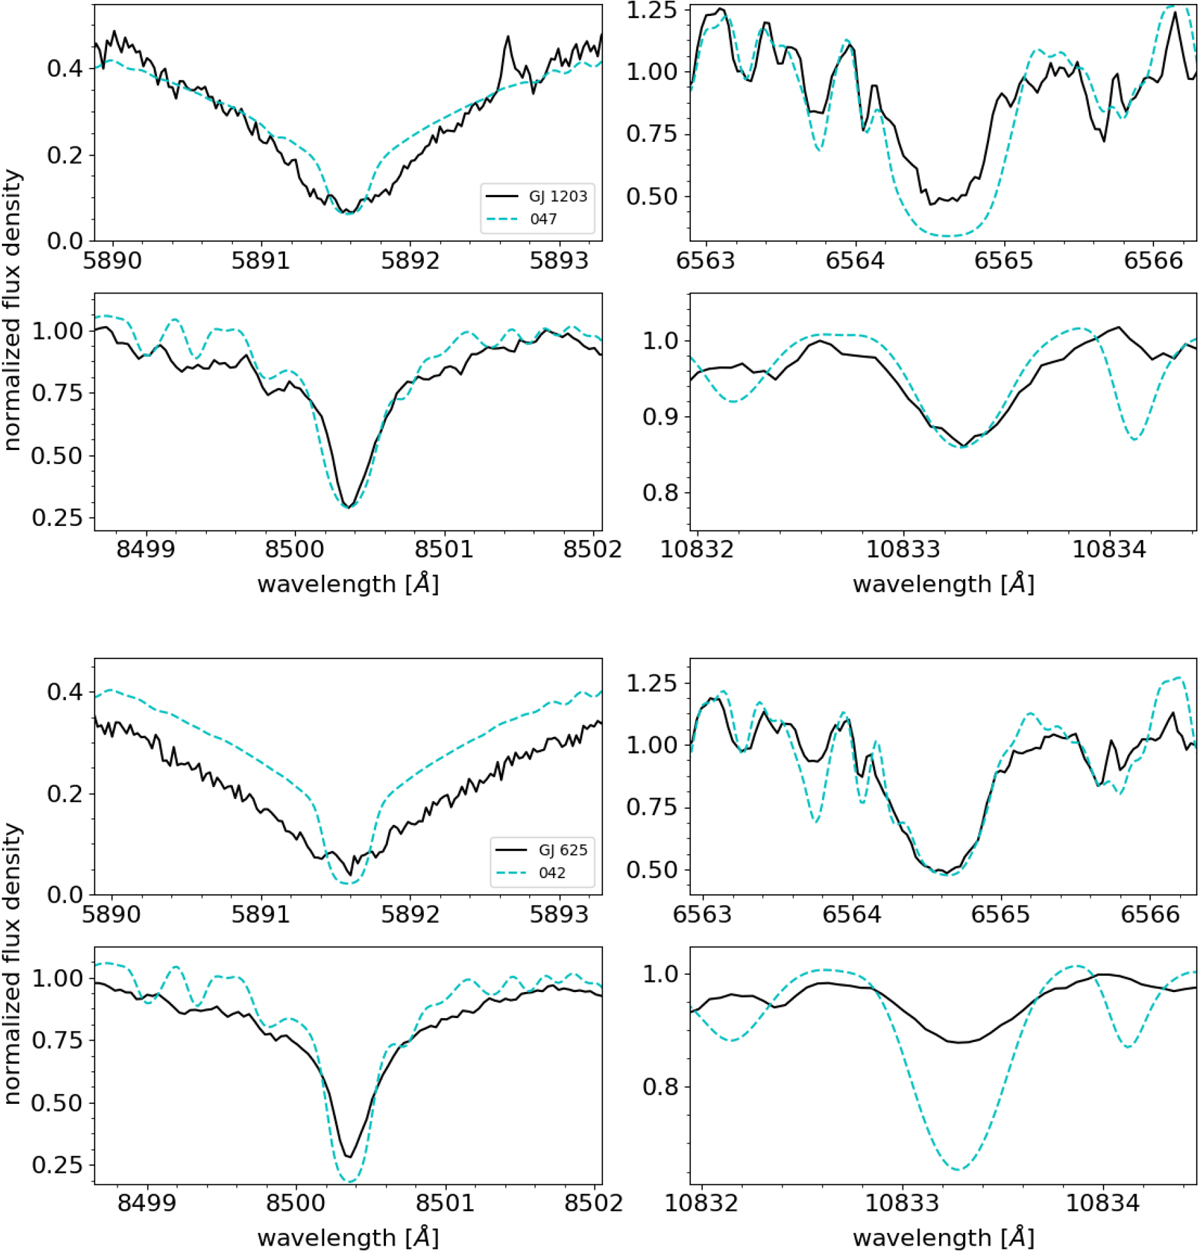
Upper panel: comparison of the best-fit model spectrum (dashed cyan line, model 047) toan observed spectrum (solid black line) of GJ 1203 optimized for the lines of Na I D2 (top left panel), Hα (top right panel), and the bluest Ca II IRT line (bottom left panel). In the range of the He I IR line (bottom right panel), the observed CARMENES template obtained with SERVAL is shown. The emission line redward of the Na I D2 line in the observation of GJ 1203 is an airglow line. Bottom panel: same as in the upper plot for GJ 625 (model 042).
Current usage metrics show cumulative count of Article Views (full-text article views including HTML views, PDF and ePub downloads, according to the available data) and Abstracts Views on Vision4Press platform.
Data correspond to usage on the plateform after 2015. The current usage metrics is available 48-96 hours after online publication and is updated daily on week days.
Initial download of the metrics may take a while.