Fig. 6
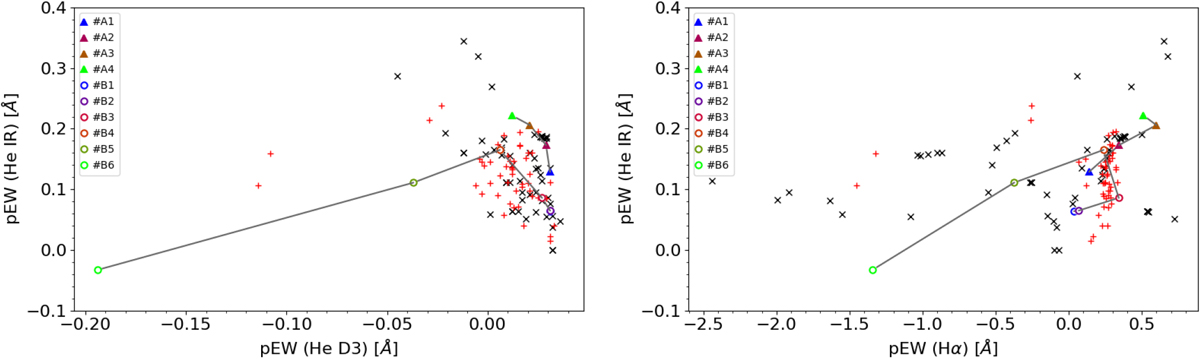
pEWs of the He I IR line as a function of the pEWs of the He I D3 (left panel), and Hα (right panel) lines. Black crosses represent the nonflaring models from Hintz et al. (2019). Series A and B are depicted by color-coded squares (the color-coding corresponds to that of Fig. 2). CARMENES observations of the investigated M 2–M 3 V stars are flagged by red pluses. In the observed pEW(He I D3) of the stellar sample, we add an offset of 0.06 Å because these measurements are influenced by a decline in flux in the respective normalization reference bands from the blue to the red continuum.
Current usage metrics show cumulative count of Article Views (full-text article views including HTML views, PDF and ePub downloads, according to the available data) and Abstracts Views on Vision4Press platform.
Data correspond to usage on the plateform after 2015. The current usage metrics is available 48-96 hours after online publication and is updated daily on week days.
Initial download of the metrics may take a while.