Fig. 5
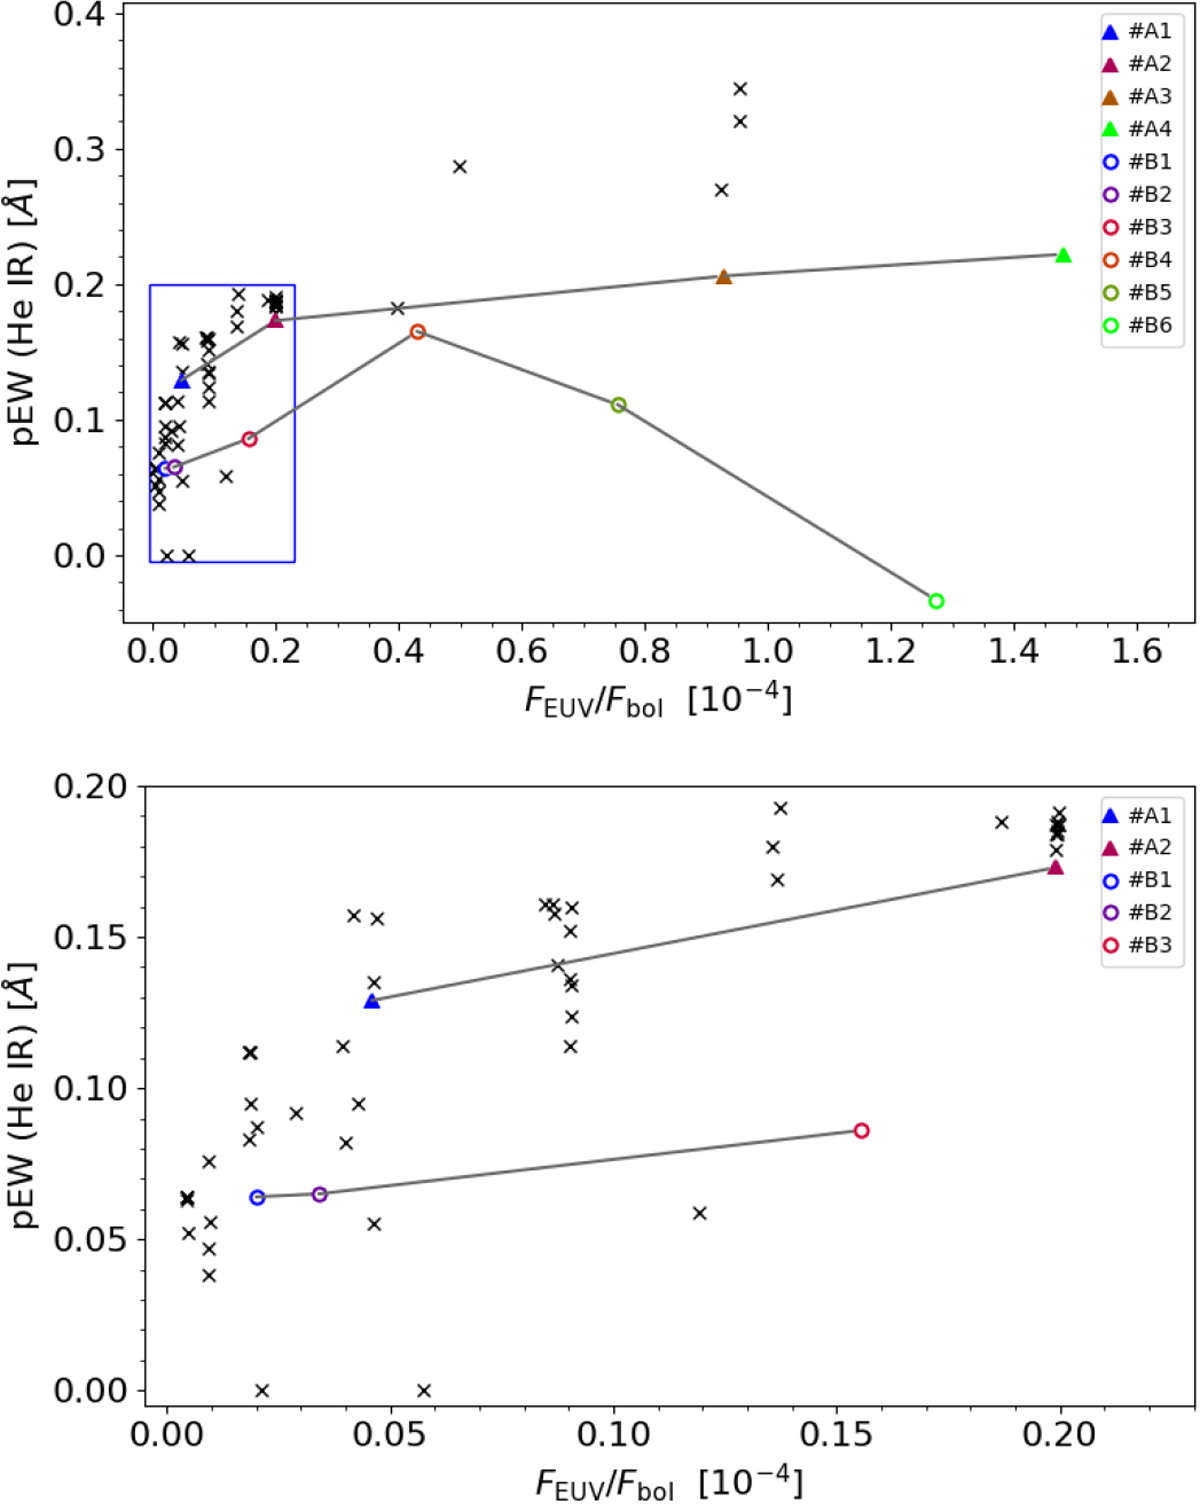
He I IR pEW as a function of the integrated EUV flux at λ ≤ 504 Å (vacuum). The color-coded models correspond to the new series A and B of models as given in Fig. 2. Black crosses represent the previously nonflaring models from Hintz et al. (2019) as given in Table A.1. The region marked by the blue rectangular in the upper panel is enlarged in the lower panel and shows our most quiescent models.
Current usage metrics show cumulative count of Article Views (full-text article views including HTML views, PDF and ePub downloads, according to the available data) and Abstracts Views on Vision4Press platform.
Data correspond to usage on the plateform after 2015. The current usage metrics is available 48-96 hours after online publication and is updated daily on week days.
Initial download of the metrics may take a while.