Fig. 4
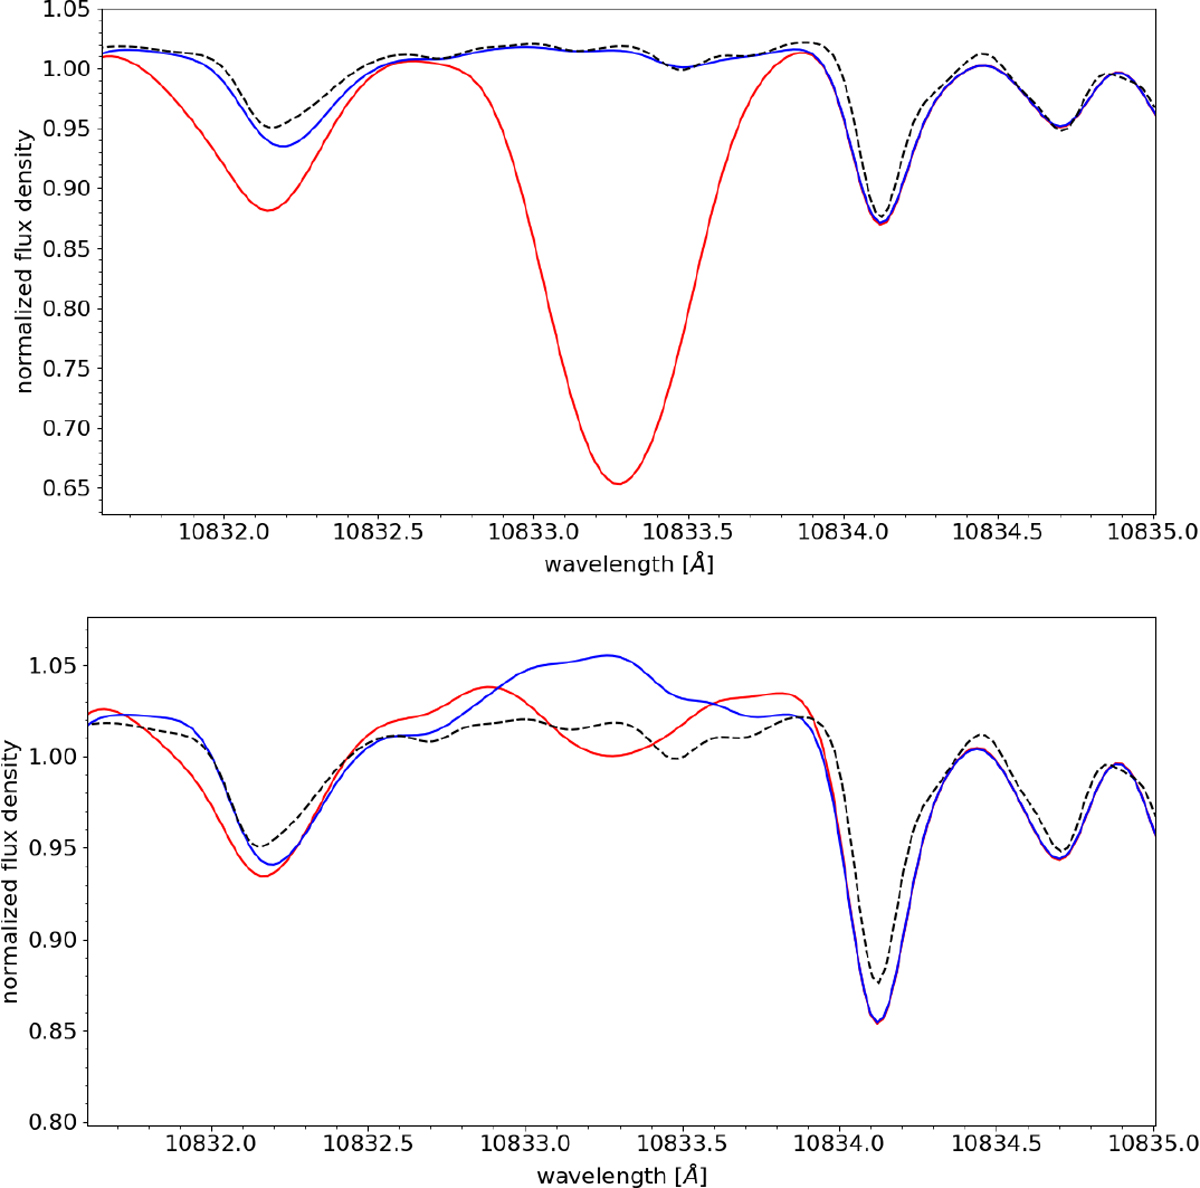
Spectral ranges of the He I IR line in models A2 (upper panel) and B6 (lower panel) in the original configuration (red lines) and when the radiation field below 504 Å (blue lines) is omitted. The dashed black line shows the underlying photosphere alone (from Husser et al. 2013 with Teff = 3500 K, log g =5.0 dex, [Fe ∕H ] = 0.0 dex, and [α∕Fe] = 0.0 dex).
Current usage metrics show cumulative count of Article Views (full-text article views including HTML views, PDF and ePub downloads, according to the available data) and Abstracts Views on Vision4Press platform.
Data correspond to usage on the plateform after 2015. The current usage metrics is available 48-96 hours after online publication and is updated daily on week days.
Initial download of the metrics may take a while.