Fig. 3
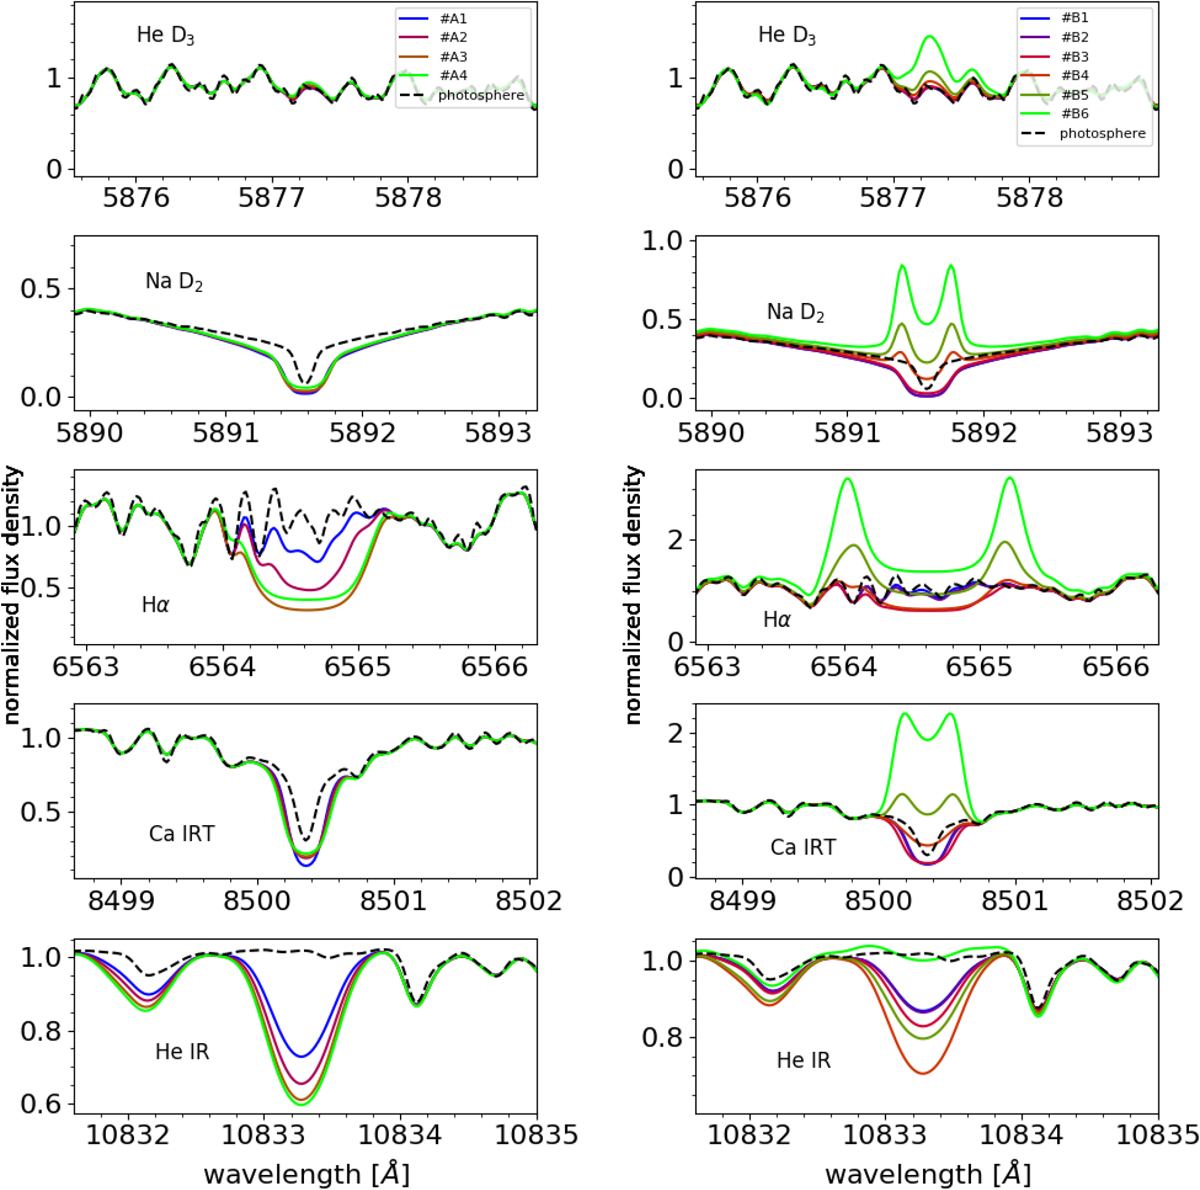
Spectra according to the temperature structures of the new series A (left panel) and B (right panel) of models in Fig. 2 (corresponding color-coding) in the spectral ranges of He I D3, Na I D2, Hα, the bluest Ca II IRT line, and the He I IR line (from top to bottom). For comparison, the underlying photosphere model (Teff =3500 K, log g =5.0 dex, [Fe ∕H ] = 0.0 dex, [α∕Fe ] = 0.0 dex) is plotted aswell. The photosphere is taken from Husser et al. (2013).
Current usage metrics show cumulative count of Article Views (full-text article views including HTML views, PDF and ePub downloads, according to the available data) and Abstracts Views on Vision4Press platform.
Data correspond to usage on the plateform after 2015. The current usage metrics is available 48-96 hours after online publication and is updated daily on week days.
Initial download of the metrics may take a while.