Fig. 2
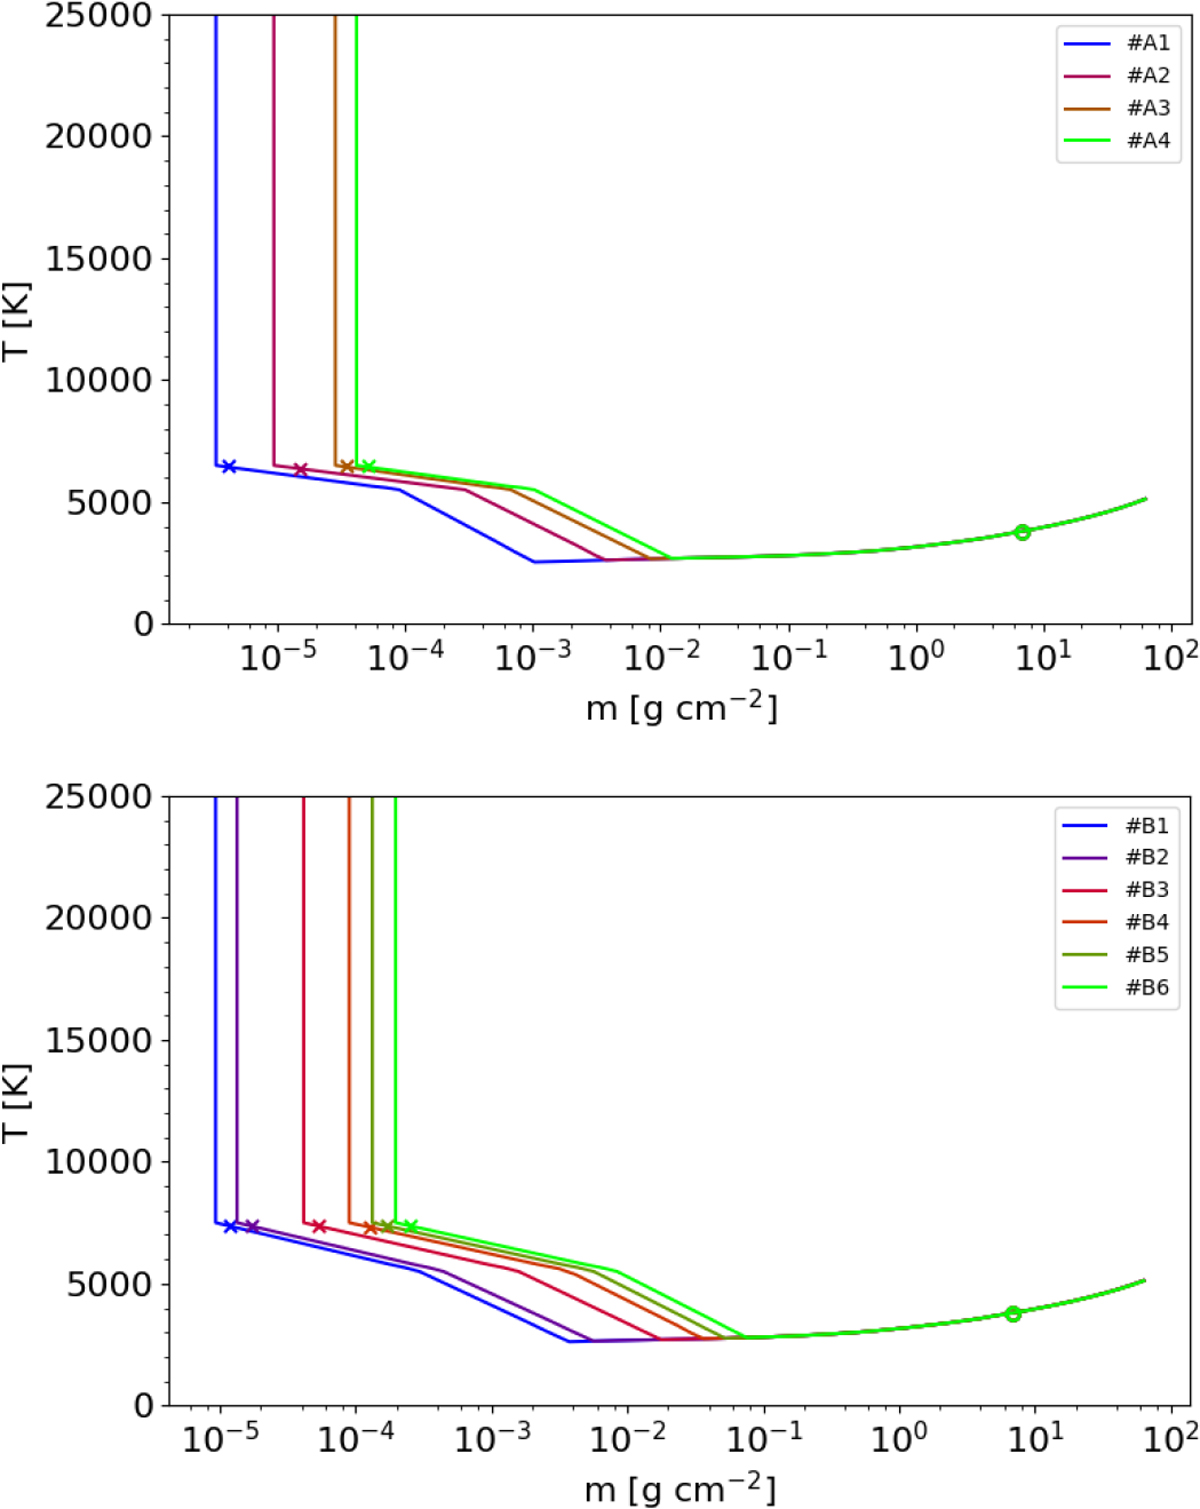
Model temperature profiles as a function of the column mass densities. The respective model parameters are given in Table 1. The temperature structures of series A are shown in the top panel, and those of series B are depicted in the bottom panel. Models A2 and B4 in these series correspond to models 042 and 080 from Hintz et al. (2019), respectively.In both series, we also mark the structural positions where the He I IR line core (crosses) and continuum at λ = 10 834.5 Å (open circles) approach an optical depth of τ = 1, i. e., where both become optically thick.
Current usage metrics show cumulative count of Article Views (full-text article views including HTML views, PDF and ePub downloads, according to the available data) and Abstracts Views on Vision4Press platform.
Data correspond to usage on the plateform after 2015. The current usage metrics is available 48-96 hours after online publication and is updated daily on week days.
Initial download of the metrics may take a while.