Fig. 2
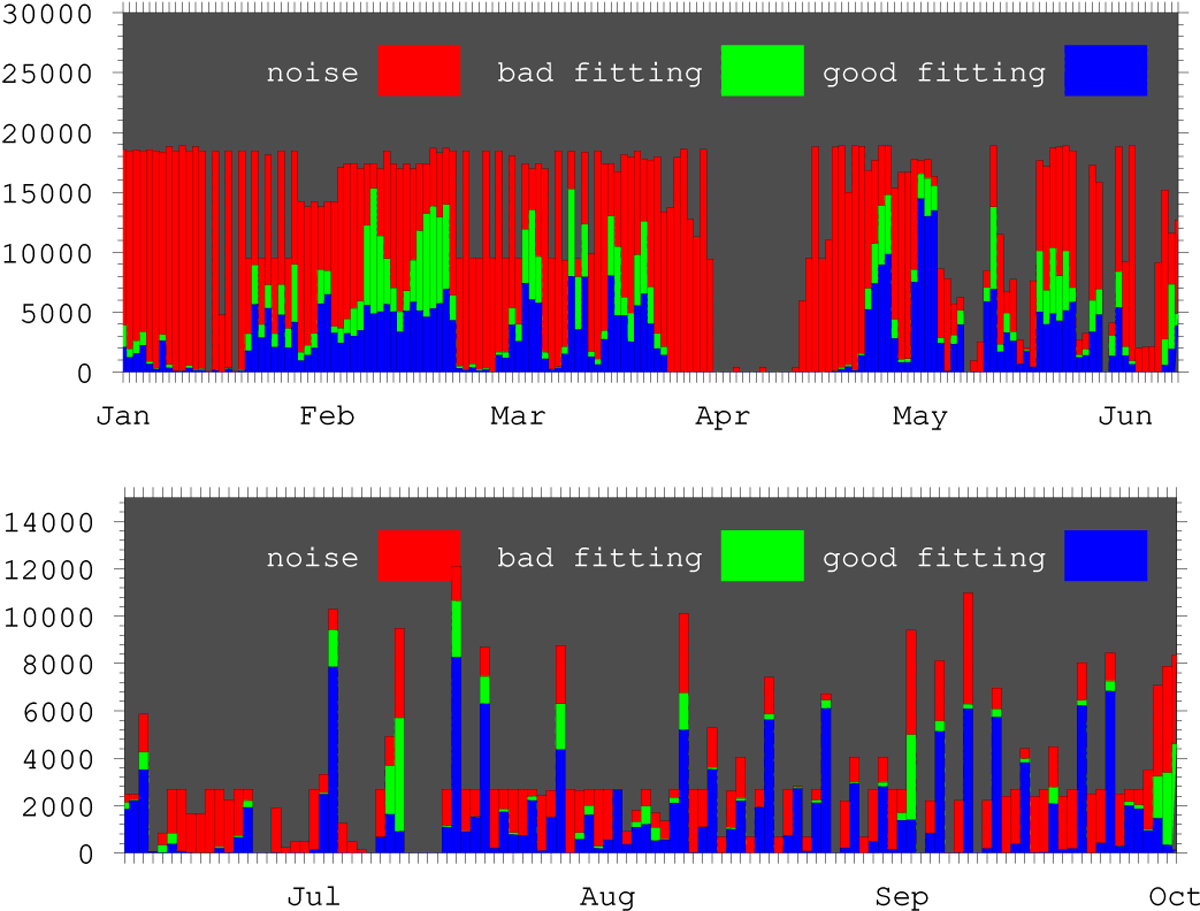
Stacked bar charts representing the number of experimental responses in which no plasma signature emerged from the noise (red area, 1 569 509 responses), the number of experimental responses in which a plasma signature emerged from the noise but that were not well fit by the simulations (green area, 305 782 responses), and the number of experimental responses in which a plasma signature emerged from the noise that were well fit by a simulation from the database (blue area, 569 441 responses) between January and the end of September 2016.
Current usage metrics show cumulative count of Article Views (full-text article views including HTML views, PDF and ePub downloads, according to the available data) and Abstracts Views on Vision4Press platform.
Data correspond to usage on the plateform after 2015. The current usage metrics is available 48-96 hours after online publication and is updated daily on week days.
Initial download of the metrics may take a while.