Fig. 1
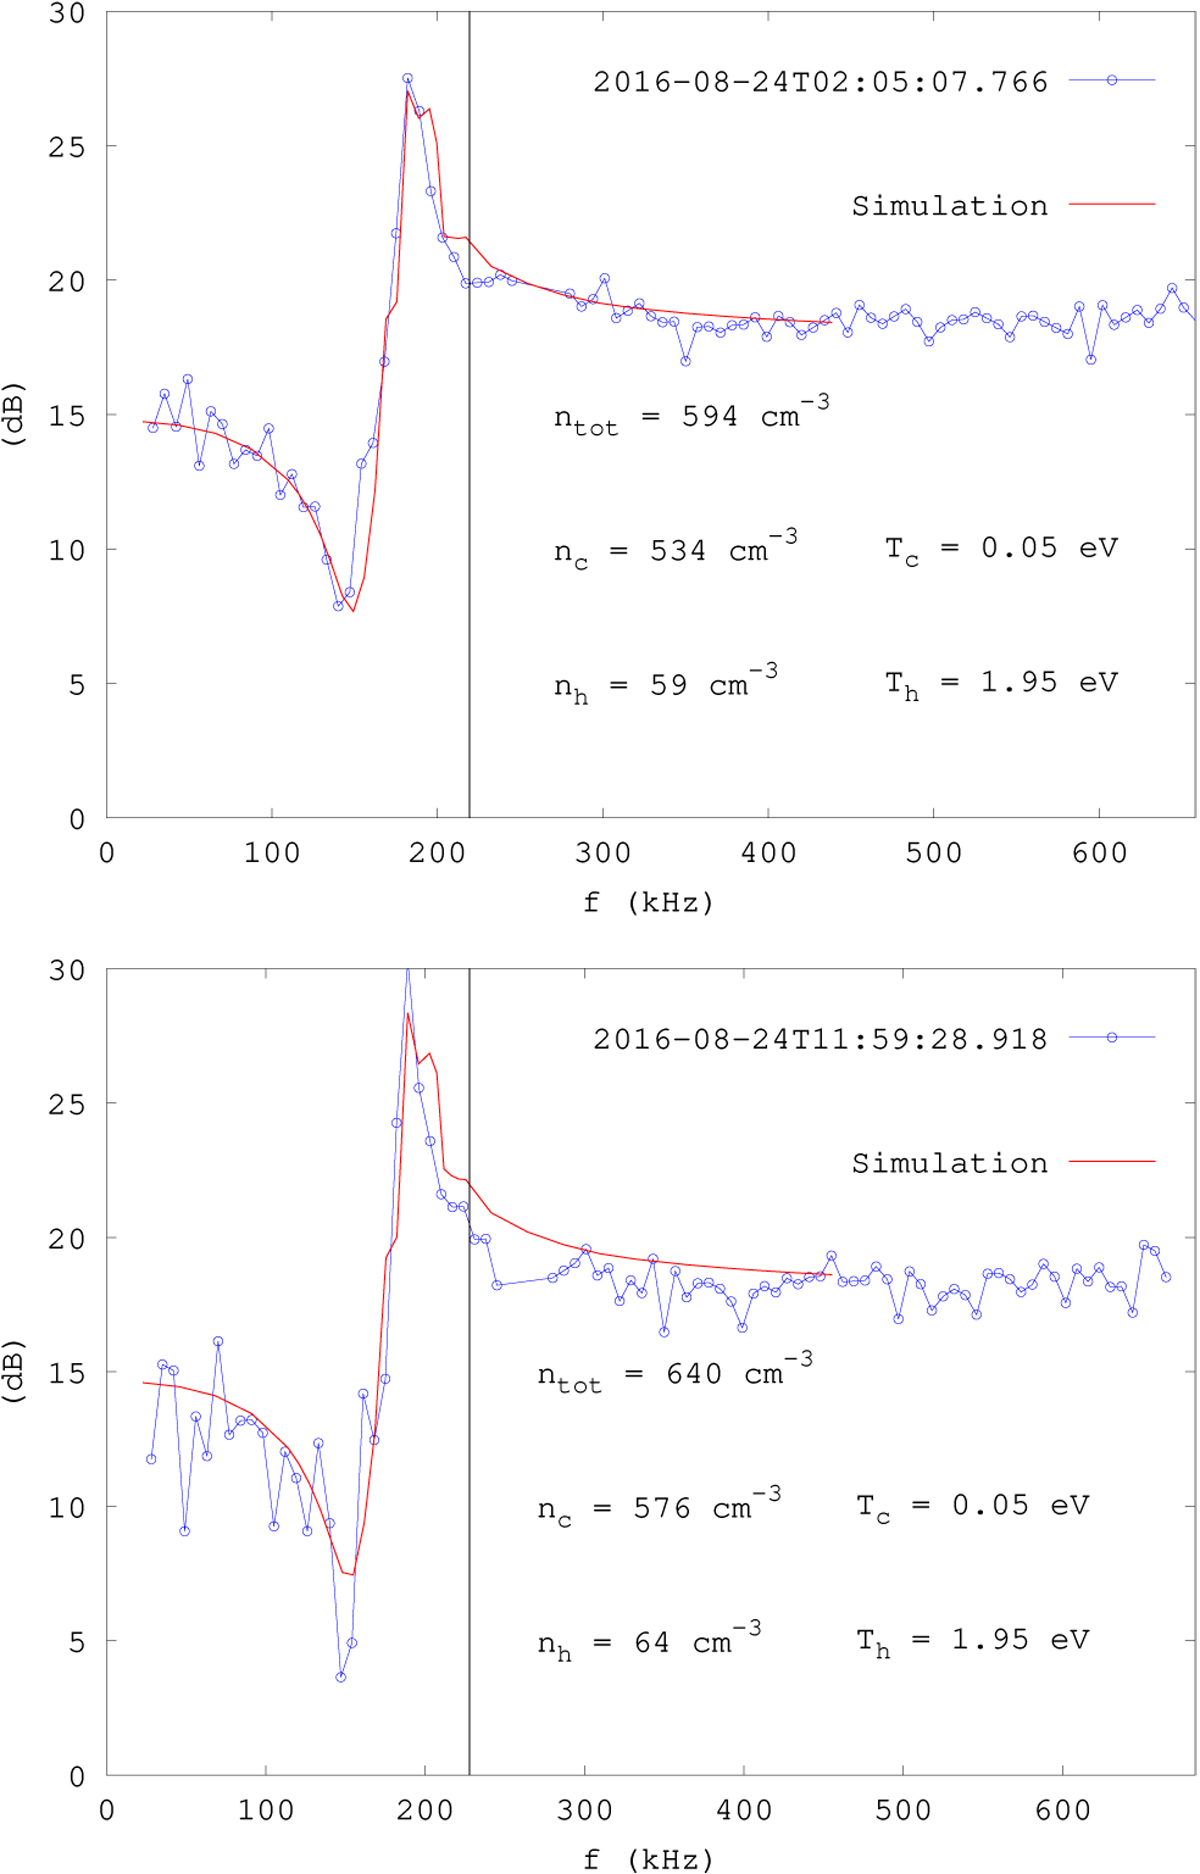
Fitting our simulated responses on experimental responses taken on 24 August 2016. The average absolute difference between simulated and experimental responses is 0.6 dB (top panel) and 1.5 dB (bottom panel), respectively. The vertical line is located at the plasma frequency. The response maximum does not exactly correspond to the total plasma frequency because there are two electron populations. The experimental noise level estimate is 3 dB in the top panel and 4 dB in the bottom panel, according to the fluctuations of the responses above 300 kHz.
Current usage metrics show cumulative count of Article Views (full-text article views including HTML views, PDF and ePub downloads, according to the available data) and Abstracts Views on Vision4Press platform.
Data correspond to usage on the plateform after 2015. The current usage metrics is available 48-96 hours after online publication and is updated daily on week days.
Initial download of the metrics may take a while.