Fig. 7
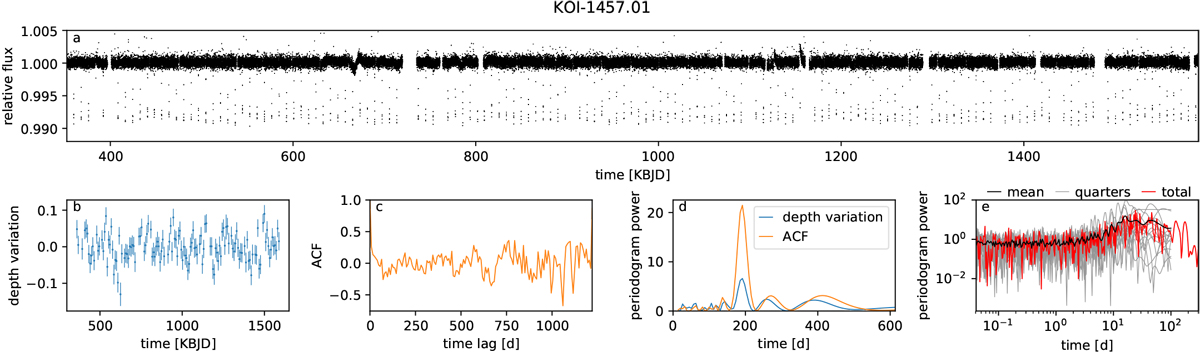
Analysis of the Kepler light curve of Kepler-856 b (KOI-1457.01). Panel a: PDCSAP Kepler light curve. Panel b: fractionaltransit depths variation from Holczer et al. (2016) for a total of 134 transits. Panel c: autocorrelation of the transit depth variation. Panel d: periodogram of the transit depth variation and periodogram of the autocorrelation function. Panel e: Periodograms of the PDCSAP flux of 14 Kepler quarters (gray lines) and their mean (black line) after masking outthe planetary transits.
Current usage metrics show cumulative count of Article Views (full-text article views including HTML views, PDF and ePub downloads, according to the available data) and Abstracts Views on Vision4Press platform.
Data correspond to usage on the plateform after 2015. The current usage metrics is available 48-96 hours after online publication and is updated daily on week days.
Initial download of the metrics may take a while.