Fig. 3
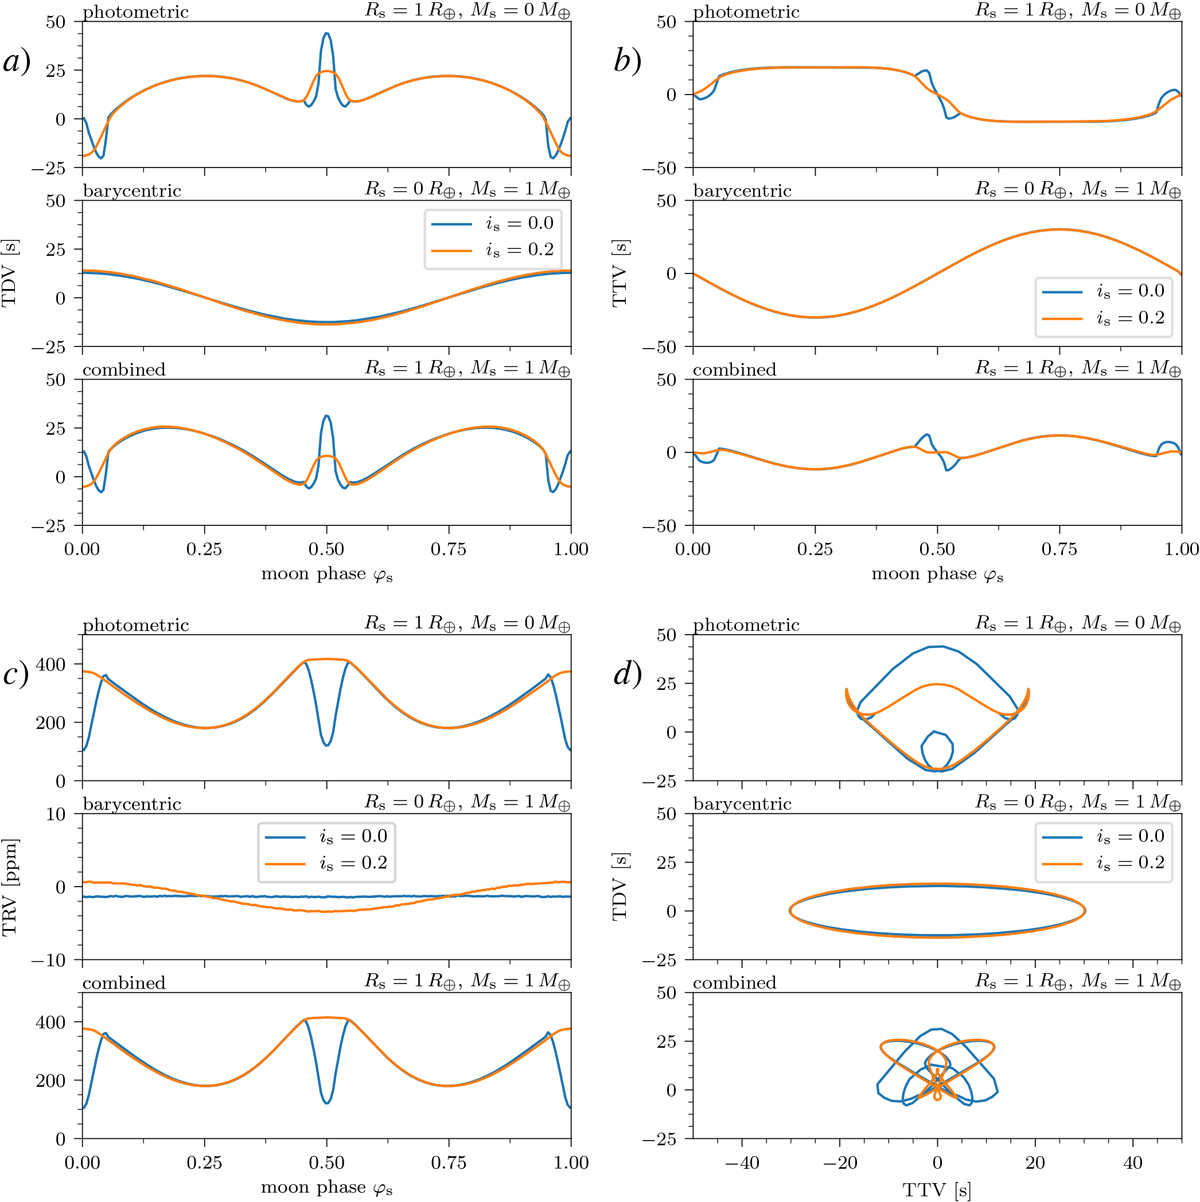
Exomoon indicators for a hypothetical Jupiter-Earth planet–moon system in a 30 d orbit around a sun-like star as measured from noiseless simulated light curves by fitting a planet-only model. Panel a: transitduration variation (TDV). Panel b: transit timing variation (TTV). Panel c: transit radius variation (TRV). Panel d: TTV vs. TDV diagram. Blue lines refer to a coplanar planet–moon system with is = 0 and orange lines depict the effects for an inclined planet–moon system with is = 0.2 rad. In each panel, the top subplot shows the photometric contribution, the center subplot the barycentric contribution, and the bottom subplot the combined and measured effect.
Current usage metrics show cumulative count of Article Views (full-text article views including HTML views, PDF and ePub downloads, according to the available data) and Abstracts Views on Vision4Press platform.
Data correspond to usage on the plateform after 2015. The current usage metrics is available 48-96 hours after online publication and is updated daily on week days.
Initial download of the metrics may take a while.