Fig. 6.
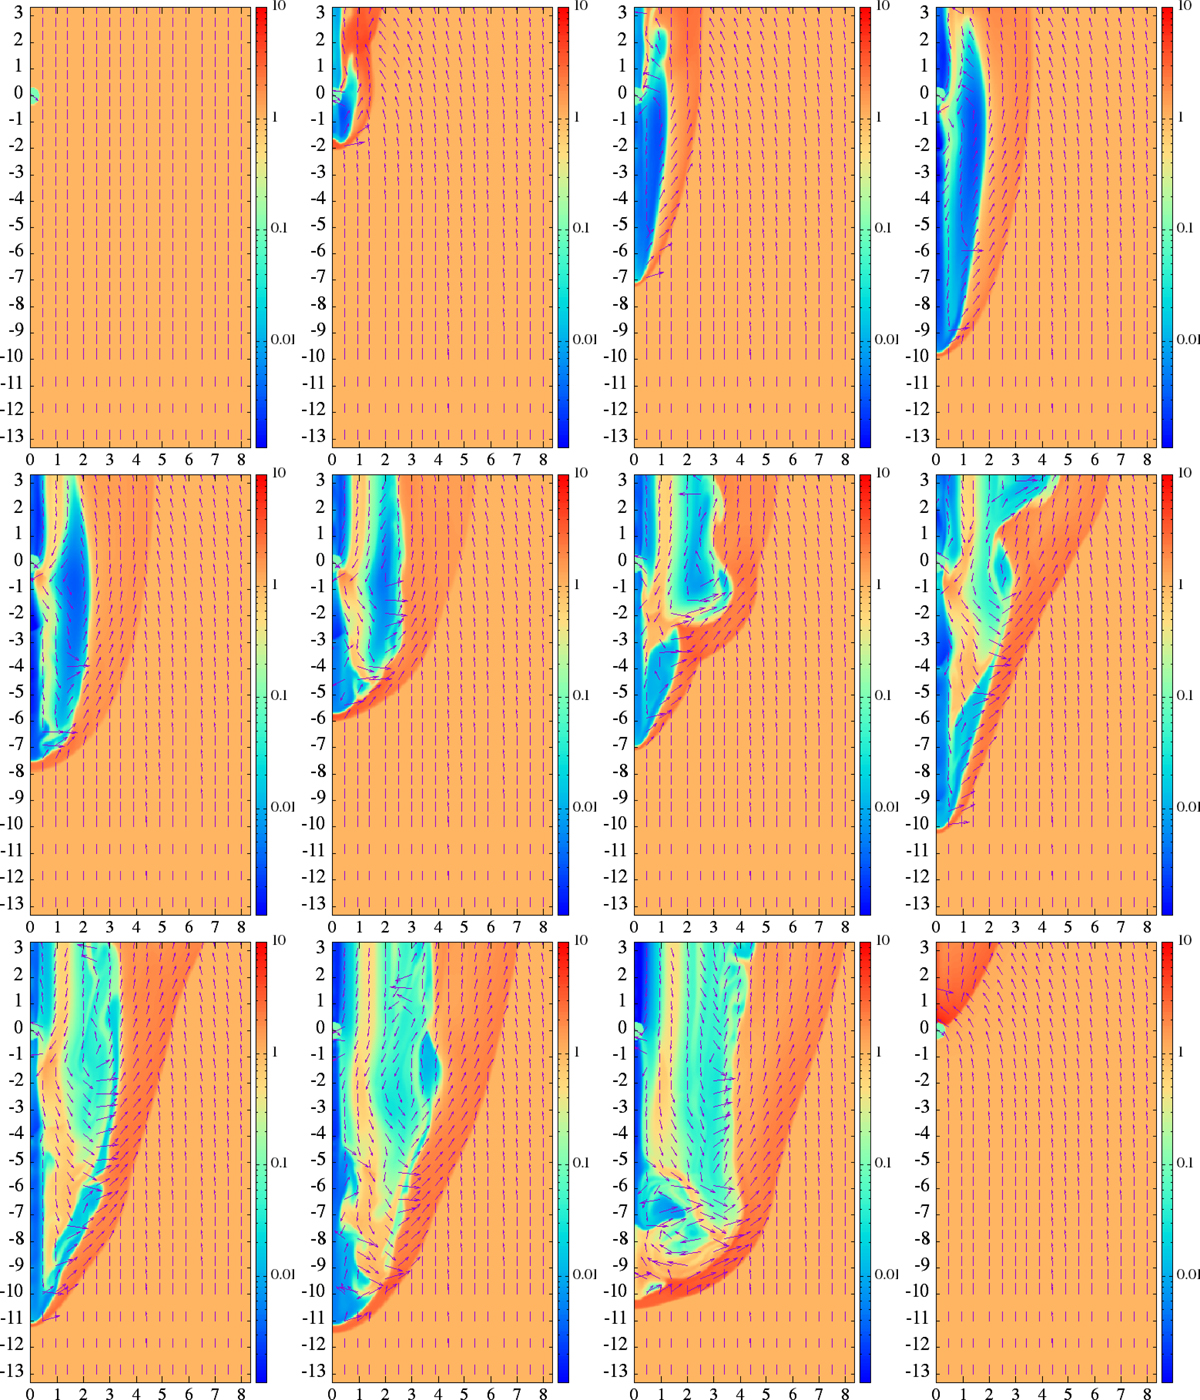
Color density maps of the outflow-medium interaction structure after (from left to right, and top to bottom) t ≈ 0, 5, 10; 15, 20, 25; 30, 35, 40; 45, 50 tacc. The bottom right density map corresponds to the case without outflow after t ≈ 50 tacc. The arrows illustrate the accreted gas trajectories. The injector-accretor region is located at (0, 0). The axis scales are normalized to racc, and the color scale is normalized to the medium density. The medium motion in the PBH reference frame is upwards.
Current usage metrics show cumulative count of Article Views (full-text article views including HTML views, PDF and ePub downloads, according to the available data) and Abstracts Views on Vision4Press platform.
Data correspond to usage on the plateform after 2015. The current usage metrics is available 48-96 hours after online publication and is updated daily on week days.
Initial download of the metrics may take a while.