Fig. 5.
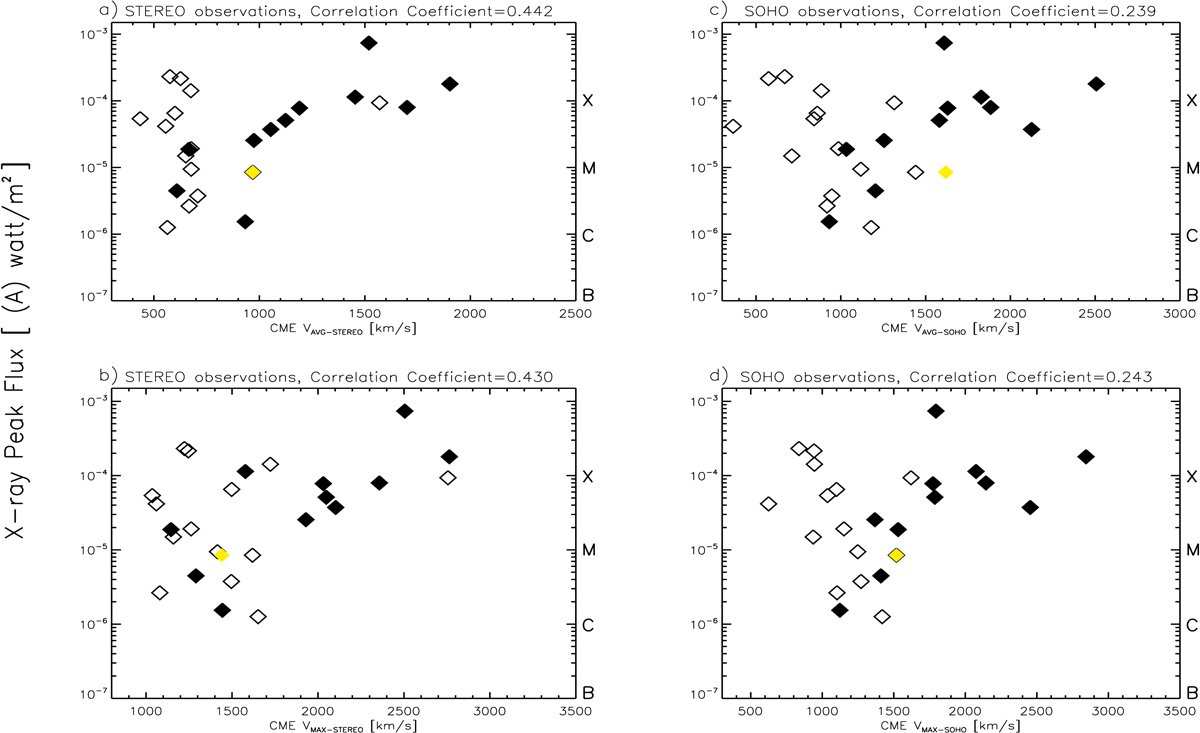
Scatter plots of X-ray peak fluxes of solar flares (0.1–0.8 nm) vs respective initial velocity of CMEs: (a) average velocity-STEREO, (b) maximum velocity-STEREO, (c) average velocity-SOHO, (d) maximum velocity-SOHO. The open symbols represent disk events (longitude −20 < L < 45) and filled symbols represent west events (Longitud >45). There is one east event, on 31 August 2012 (longitude < −20; in yellow). This is the only event in our sample analyzed by STEREO-B as it exhibited good quality.
Current usage metrics show cumulative count of Article Views (full-text article views including HTML views, PDF and ePub downloads, according to the available data) and Abstracts Views on Vision4Press platform.
Data correspond to usage on the plateform after 2015. The current usage metrics is available 48-96 hours after online publication and is updated daily on week days.
Initial download of the metrics may take a while.