Fig. 2.
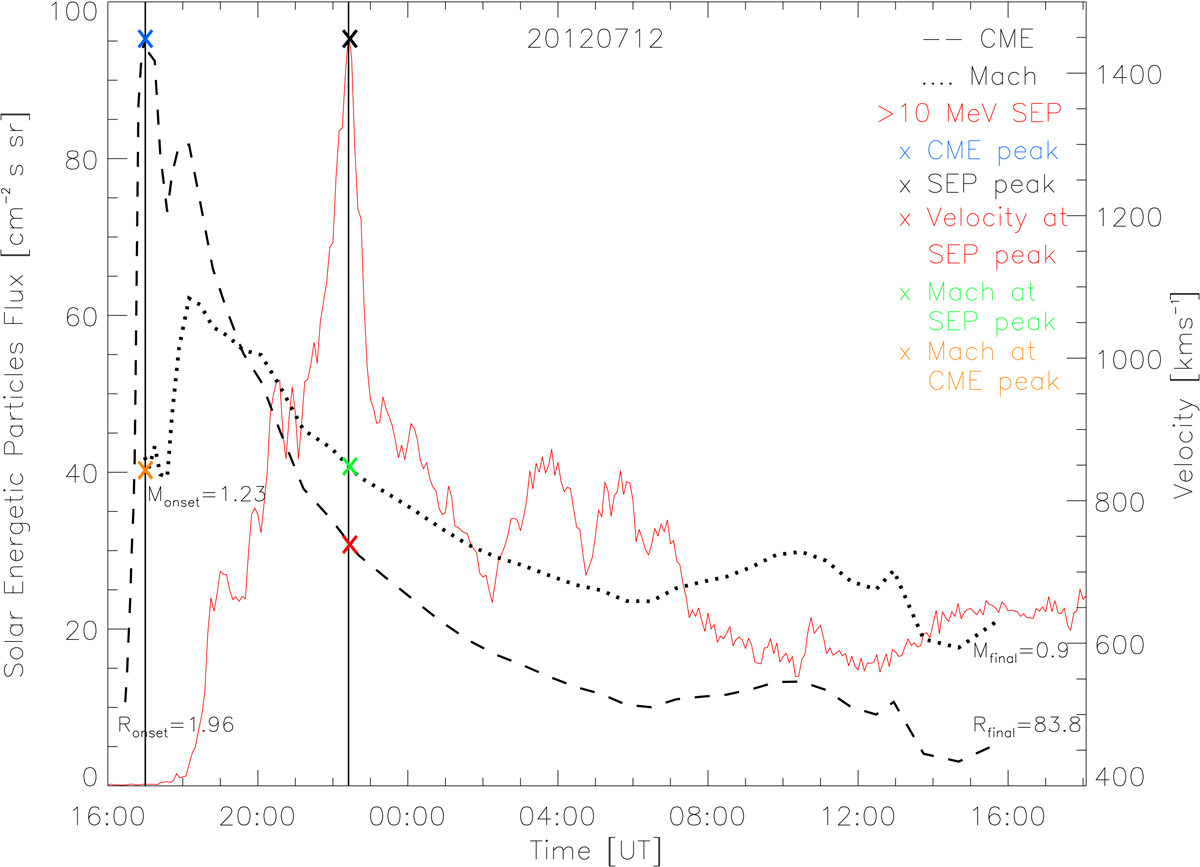
12 July 2012 event of a CME and the associated SEP. The plot shows the CME speed from STEREO (dashed line), Mach number (dotted line), and SEP flux in the >10 MeV energy band (red line) vs time. The Mach number has been scaled by (100) to match the plot. The CME peak velocity, SEP peak flux, velocity of the CME at the SEP peak flux, and Mach number at the SEP peak flux and at the CME peak velocity are shown as crosses for reference (blue, black, red, green, and orange, respectively). The onset and final values of Mach number (Monset, Mfinal) and distance from the Sun [in units Rsun] (Ronset, Rfinal) are shown in the figure.
Current usage metrics show cumulative count of Article Views (full-text article views including HTML views, PDF and ePub downloads, according to the available data) and Abstracts Views on Vision4Press platform.
Data correspond to usage on the plateform after 2015. The current usage metrics is available 48-96 hours after online publication and is updated daily on week days.
Initial download of the metrics may take a while.