Fig. 11
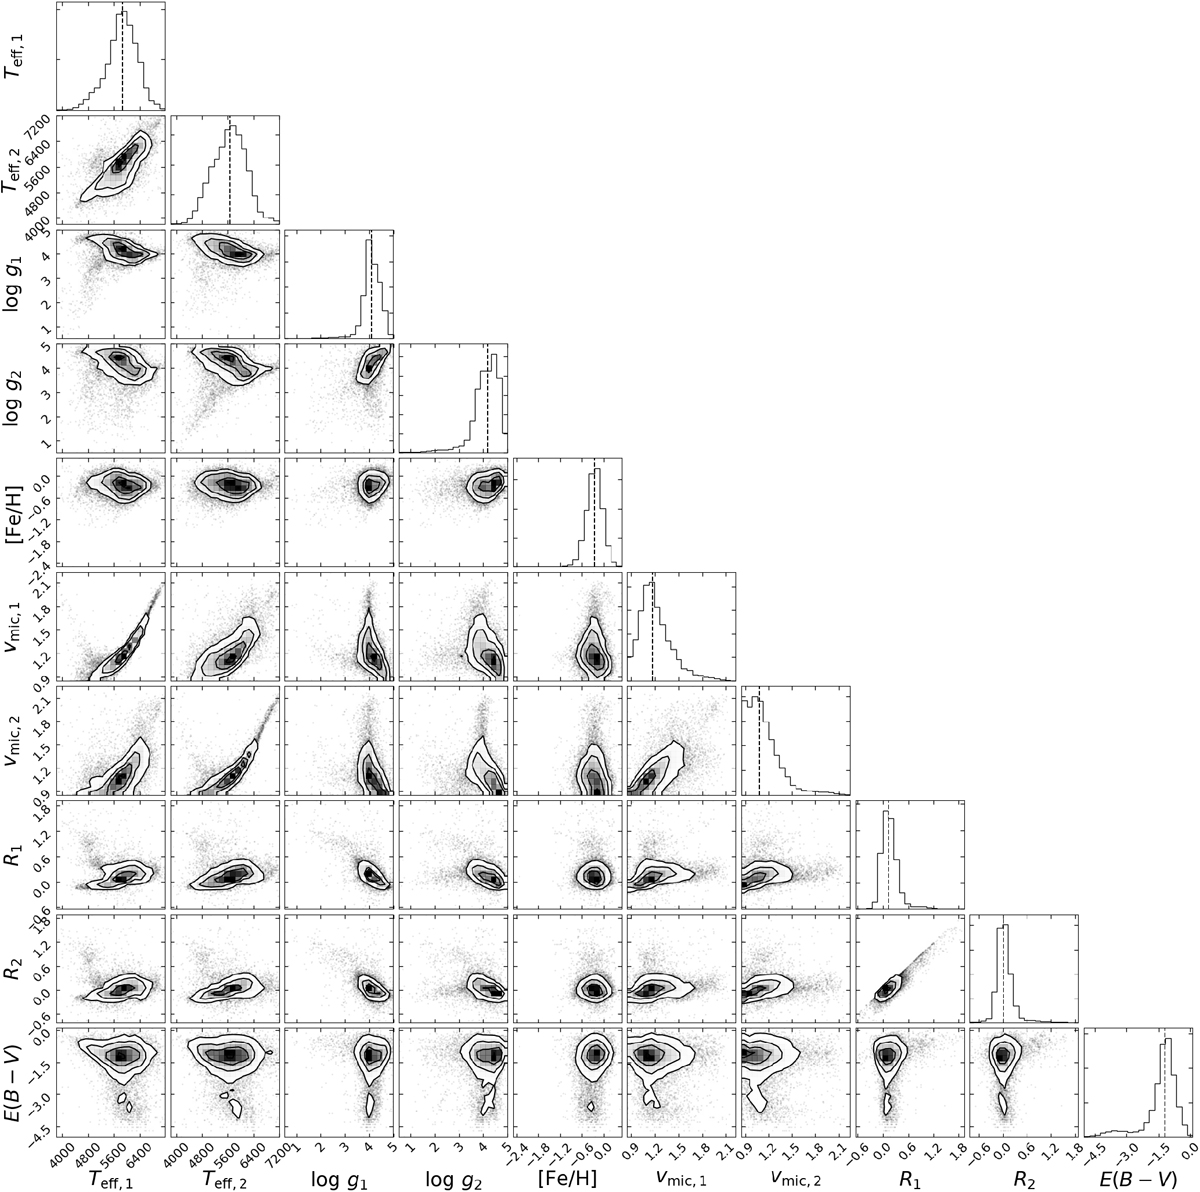
Ensemble of derived parameters for the final sample of analysed binary systems. Distributions of θ parametervalues for 12 760 analysed objects are shown with diagonal panels, whereas the other panels indicate correlations between these model parameters. The associated uncertainty distributions are displayed in Fig. D.1. For clarity, we show the logarithm (base 10) of values for R1, R2, and E(B−V). The parameter units are given in Table 2.
Current usage metrics show cumulative count of Article Views (full-text article views including HTML views, PDF and ePub downloads, according to the available data) and Abstracts Views on Vision4Press platform.
Data correspond to usage on the plateform after 2015. The current usage metrics is available 48-96 hours after online publication and is updated daily on week days.
Initial download of the metrics may take a while.