Fig. 7.
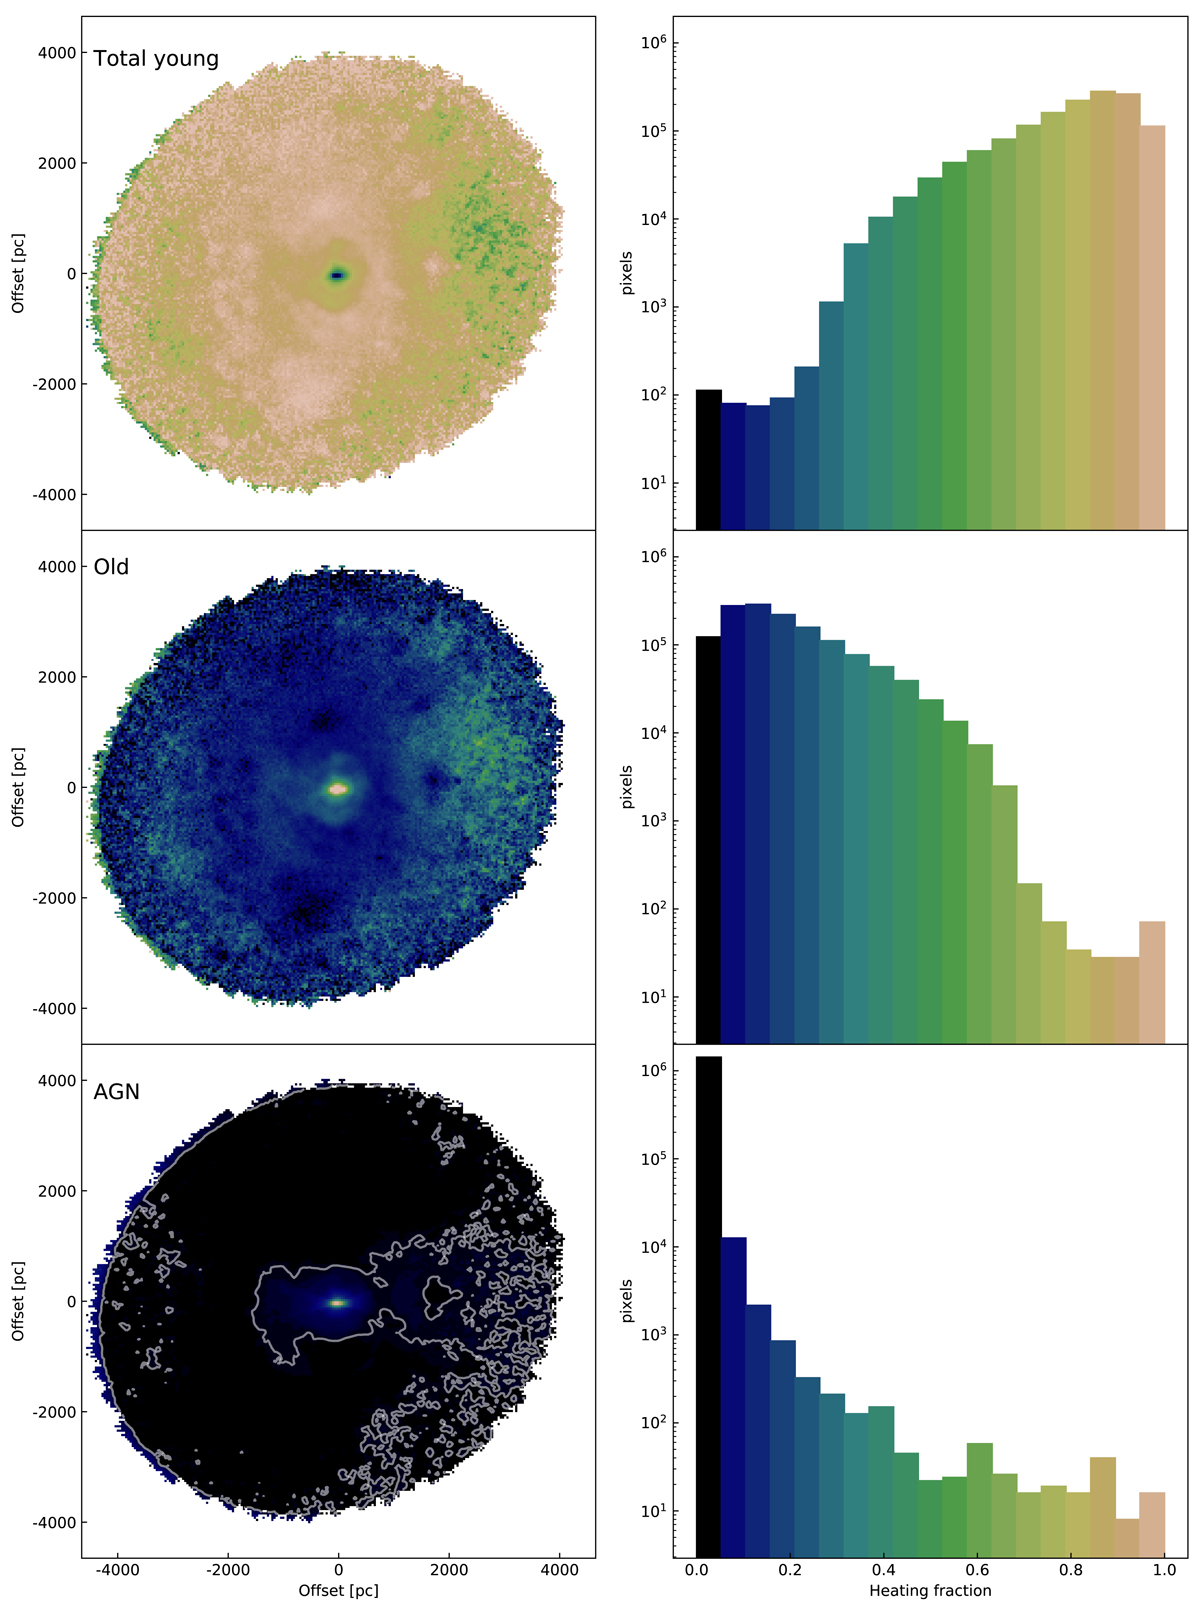
Dust heating fractions in a slice through the mid-plane of the face-on view of our model (left panels). The direction of the AGN beam is aligned with the horizontal axis of the figure. The colour code is set on the histograms on the right. The histograms contain all dust cells (including the ones above and below the midplane). Top row corresponds to fyoung, middle row to fold, and bottom row to fAGN. The white contour corresponds to the 0.5% level in fAGN and highlights an asymmetry in the heating of dust in the disc.
Current usage metrics show cumulative count of Article Views (full-text article views including HTML views, PDF and ePub downloads, according to the available data) and Abstracts Views on Vision4Press platform.
Data correspond to usage on the plateform after 2015. The current usage metrics is available 48-96 hours after online publication and is updated daily on week days.
Initial download of the metrics may take a while.