Fig. 4.
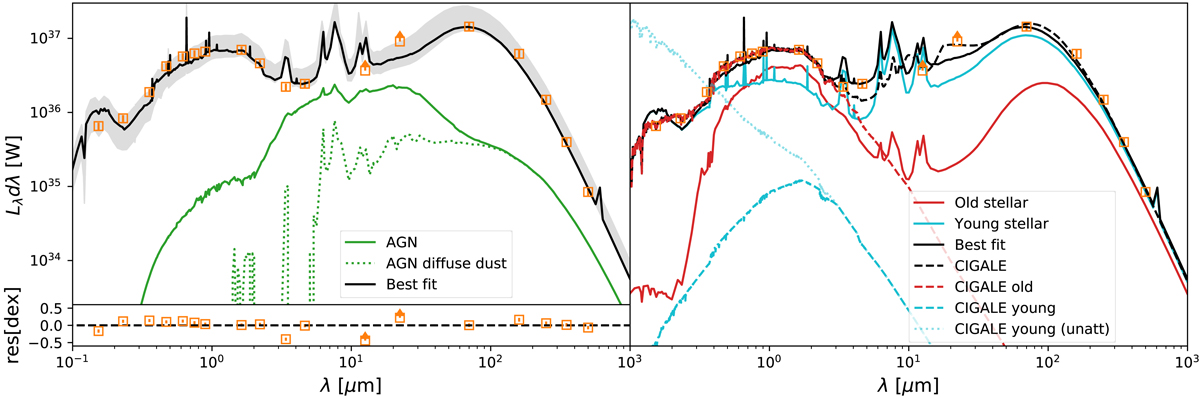
Spectral energy distributions from the best-fit model for NGC 1068. Left: global SED (black line) fits to the observed (orange) broadband fluxes. The grey shading indicates the 16th to 84th percentile area around the fit. Triangles indicate lower limits. The corresponding residuals are shown in the bottom panel. The solid green line shows the total emission for a model with only the AGN + dust component. The dotted green line then corresponds to the light reprocessed by the diffuse dust only in this simulation. Right: same best-fit SED and data points. The solid blue and red lines correspond to simulations where only one component (young or old, respectively) is present alongside the dust. A CIGALE model is also shown (dashed black line). This model can be decomposed into young and old populations (blue and red dashed lines, respectively). The intrinsic young population (blue dotted line) of the CIGALE fit is also shown.
Current usage metrics show cumulative count of Article Views (full-text article views including HTML views, PDF and ePub downloads, according to the available data) and Abstracts Views on Vision4Press platform.
Data correspond to usage on the plateform after 2015. The current usage metrics is available 48-96 hours after online publication and is updated daily on week days.
Initial download of the metrics may take a while.