Fig. B.2.
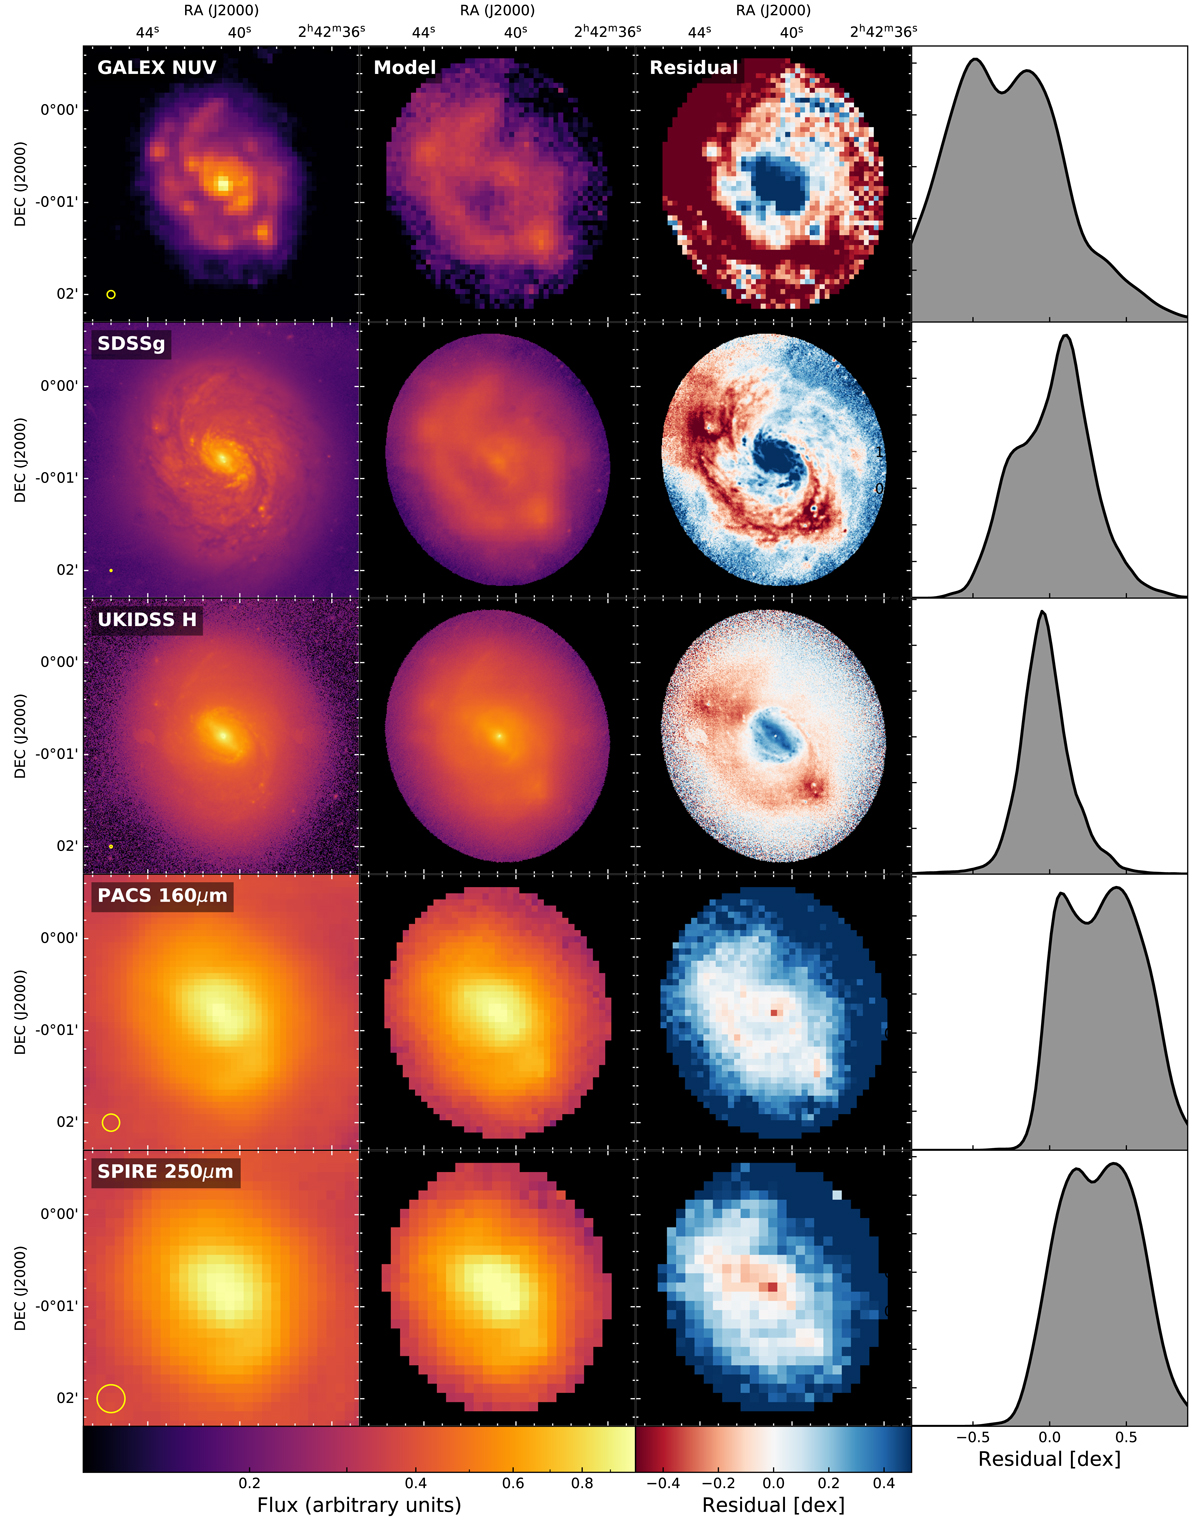
Same as Fig. 5 but for the alternative dust mass map. Spatial comparison of the model to observed broad-band images (left column). The second column contains the model images. We note that the model images are not convolved by any PSF and only hold the intrinsic model PSF (a composite of the input images). Residual images are shown in the third column. Corresponding residual distributions are represented by KDE plots in the right column. The area under the KDE curves is normalised to 1.
Current usage metrics show cumulative count of Article Views (full-text article views including HTML views, PDF and ePub downloads, according to the available data) and Abstracts Views on Vision4Press platform.
Data correspond to usage on the plateform after 2015. The current usage metrics is available 48-96 hours after online publication and is updated daily on week days.
Initial download of the metrics may take a while.