Fig. B.1.
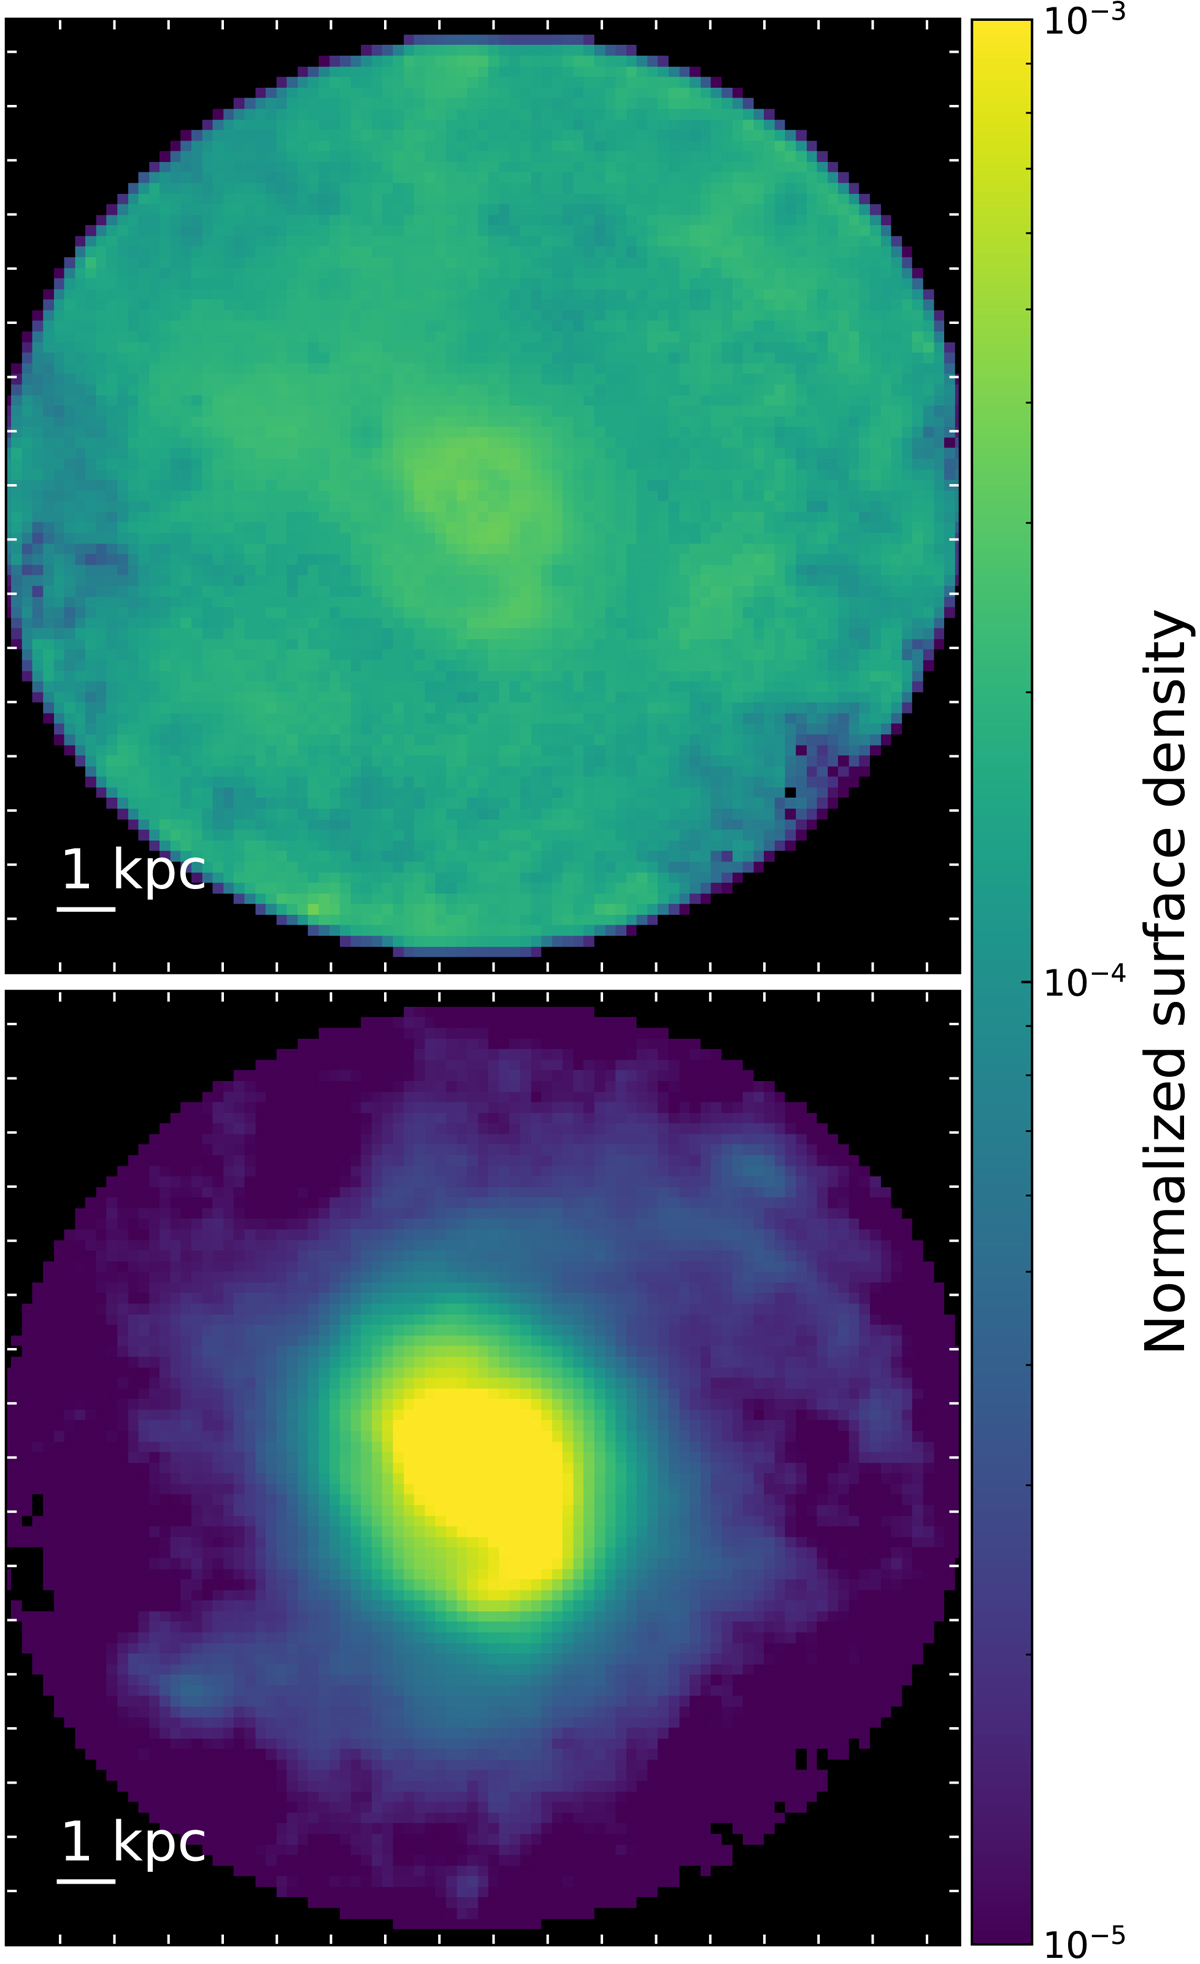
Two-dimensional representations (on the plane of the sky) of the dust mass surface density used as input morphologies for the 3D dust distribution. The top panel is the same AFUV based map as in Fig. 1 but on a logarithmic colour scale. The bottom panel is the alternative dust mass map based on the PACS 70 μm image, which peaks strongly in the centre.
Current usage metrics show cumulative count of Article Views (full-text article views including HTML views, PDF and ePub downloads, according to the available data) and Abstracts Views on Vision4Press platform.
Data correspond to usage on the plateform after 2015. The current usage metrics is available 48-96 hours after online publication and is updated daily on week days.
Initial download of the metrics may take a while.