Fig. 7.
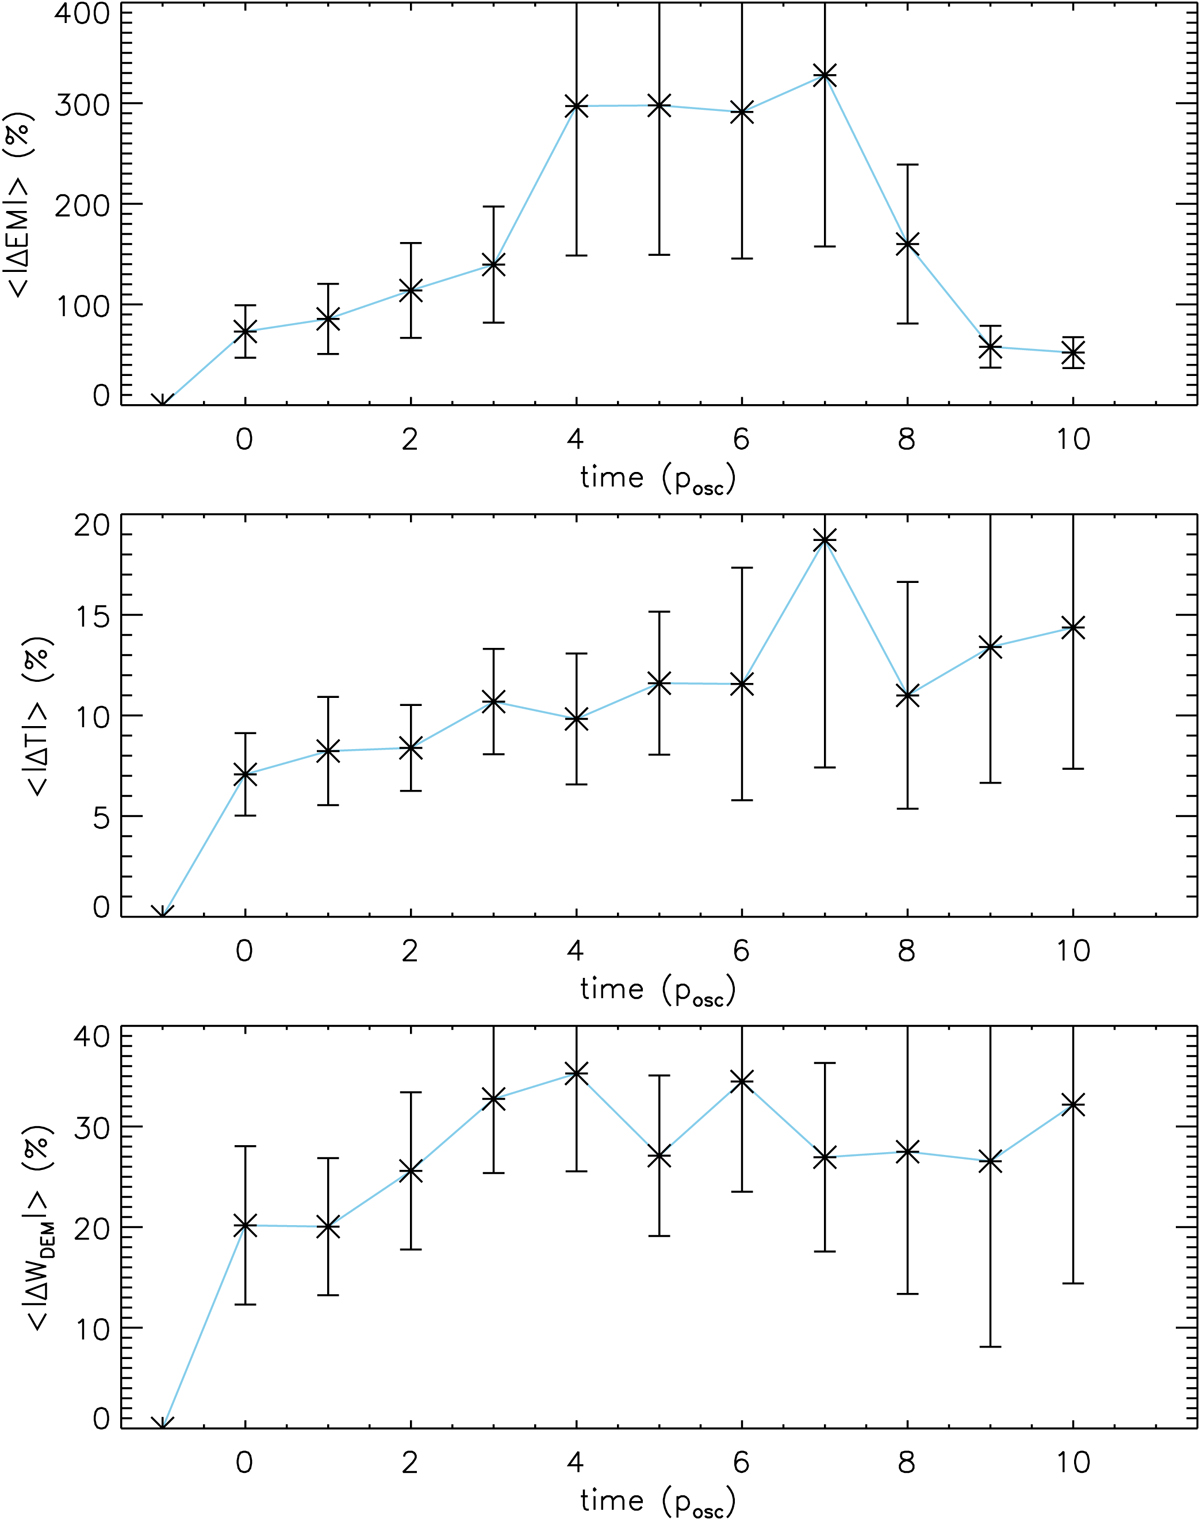
Time series of the unsigned percentage variations of EM, T, and WDEM averaged over the oscillation period, and then over all events. The percentage change is with respect to the starting value, at −1 posc (before the initial perturbation). Zero represents the first oscillation period immediately following the initial perturbation of the loop (t0). The time series extends until 10 posc after t0.
Current usage metrics show cumulative count of Article Views (full-text article views including HTML views, PDF and ePub downloads, according to the available data) and Abstracts Views on Vision4Press platform.
Data correspond to usage on the plateform after 2015. The current usage metrics is available 48-96 hours after online publication and is updated daily on week days.
Initial download of the metrics may take a while.