Open Access
Fig. 6.
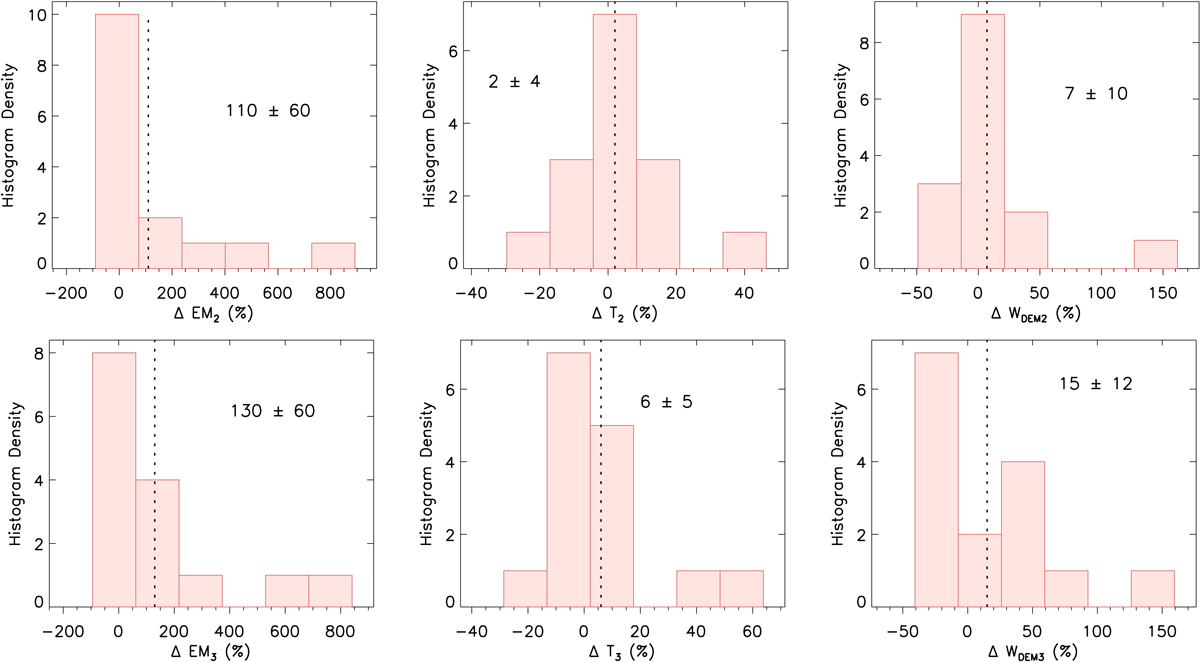
Histograms of the percentage change in EM, T, and WDEM with respect to the value at P1. The mean values and standard error are printed, and the dashed line shows the mean value.
Current usage metrics show cumulative count of Article Views (full-text article views including HTML views, PDF and ePub downloads, according to the available data) and Abstracts Views on Vision4Press platform.
Data correspond to usage on the plateform after 2015. The current usage metrics is available 48-96 hours after online publication and is updated daily on week days.
Initial download of the metrics may take a while.