Open Access
Fig. 5.
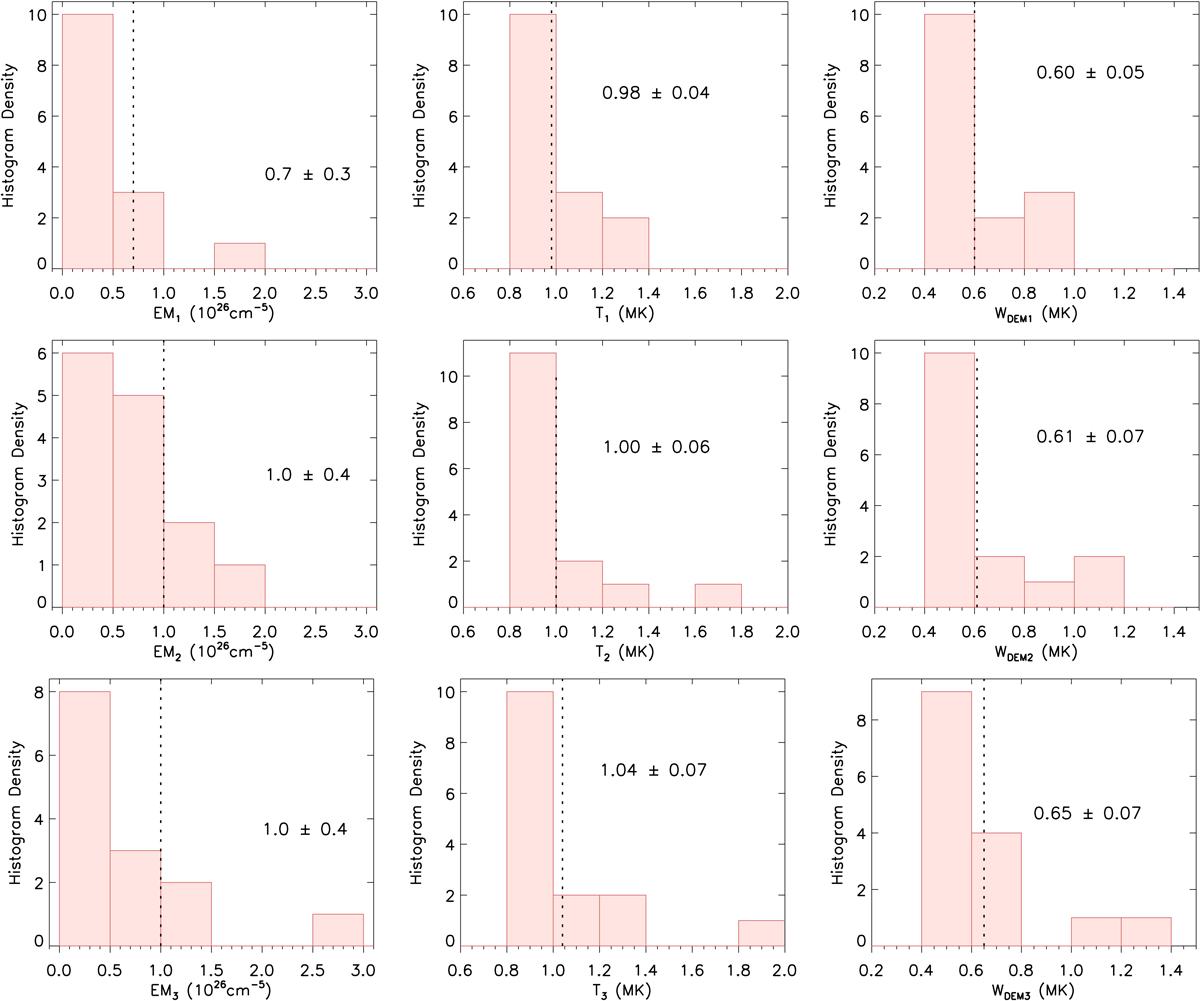
Histograms of EM, T, and WDEM, left to right, in each temporal window (P1, P2, and P3, top to bottom). The vertical dashed lines denote the mean values, as given in Table. 2. The values for some events lie outside of the plotted ranges.
Current usage metrics show cumulative count of Article Views (full-text article views including HTML views, PDF and ePub downloads, according to the available data) and Abstracts Views on Vision4Press platform.
Data correspond to usage on the plateform after 2015. The current usage metrics is available 48-96 hours after online publication and is updated daily on week days.
Initial download of the metrics may take a while.