Fig. 4.
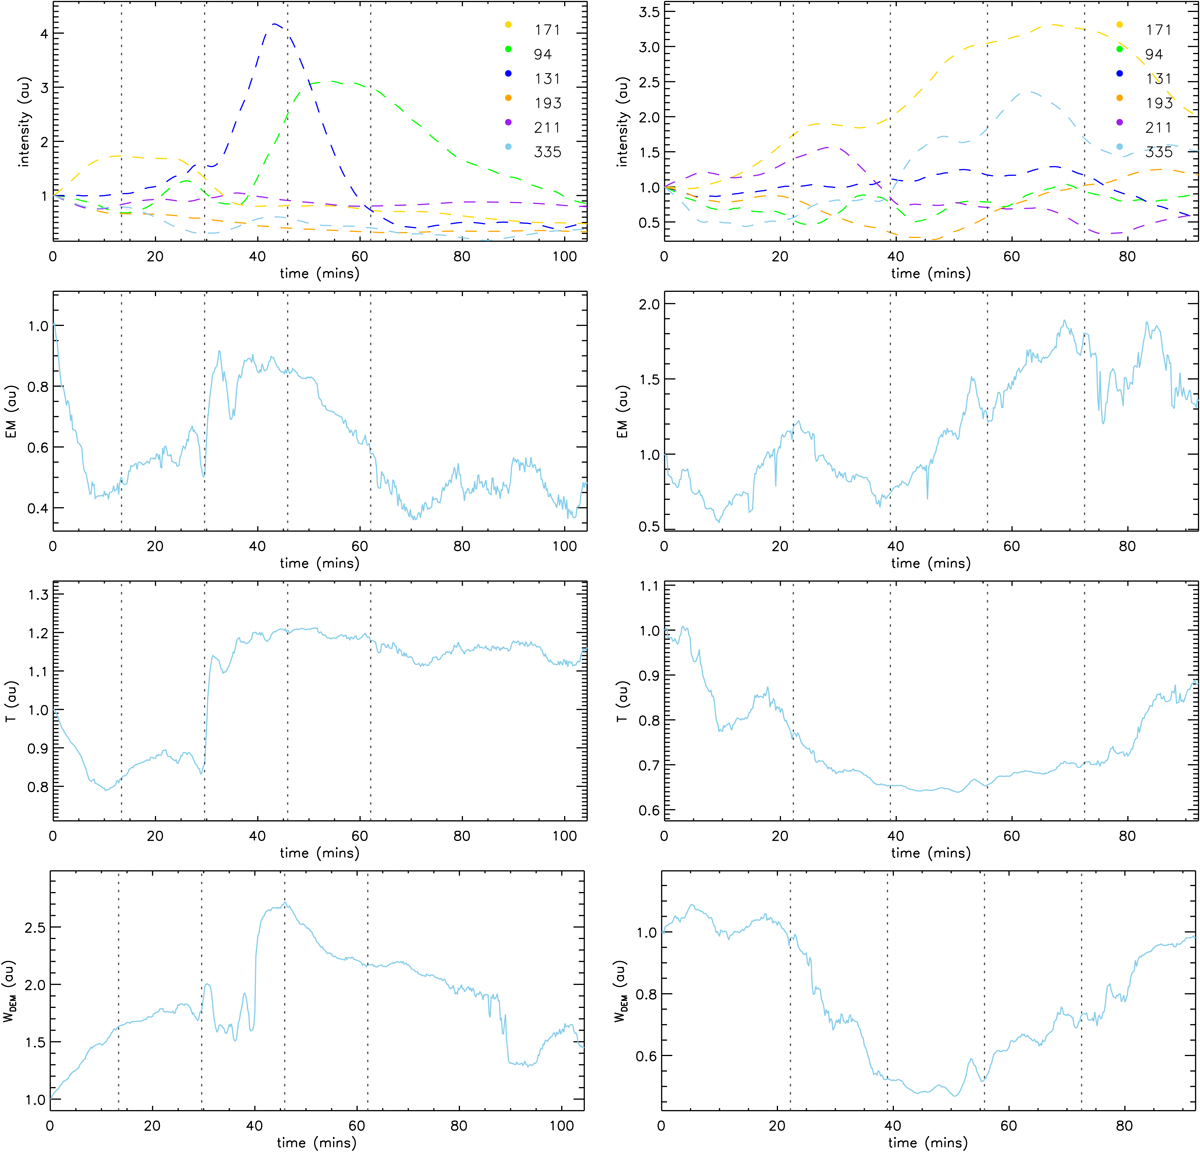
Top row: smoothed normalised intensity time-series for the six coronal wavelengths. Bottom three rows: normalised time series of EM, T, and WDEM. In all panels the vertical dashed lines enclose the three time intervals P1, P2, and P3 (as in Fig. 1). The left plots are for event 28, loop 1, and the right plots for event 37, loop 4.
Current usage metrics show cumulative count of Article Views (full-text article views including HTML views, PDF and ePub downloads, according to the available data) and Abstracts Views on Vision4Press platform.
Data correspond to usage on the plateform after 2015. The current usage metrics is available 48-96 hours after online publication and is updated daily on week days.
Initial download of the metrics may take a while.