Fig. 3.
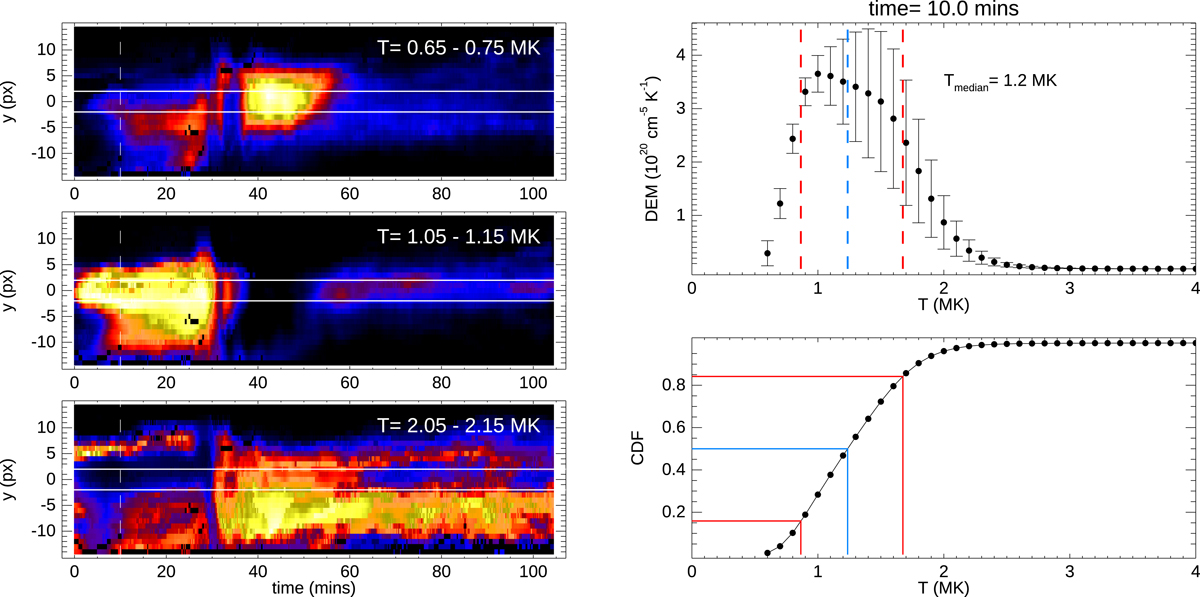
Left three panels: DEM maps for three of the temperature bins, as labelled. The two horizontal white lines denote the central five pixels, which are averaged over at each time. Right panels: distribution of DEM and CDF with temperature at 10 min (overplotted vertical white line in the left panels). The blue lines represent Tmedian, and the red lines represent Tmin, max.
Current usage metrics show cumulative count of Article Views (full-text article views including HTML views, PDF and ePub downloads, according to the available data) and Abstracts Views on Vision4Press platform.
Data correspond to usage on the plateform after 2015. The current usage metrics is available 48-96 hours after online publication and is updated daily on week days.
Initial download of the metrics may take a while.