Fig. 1.
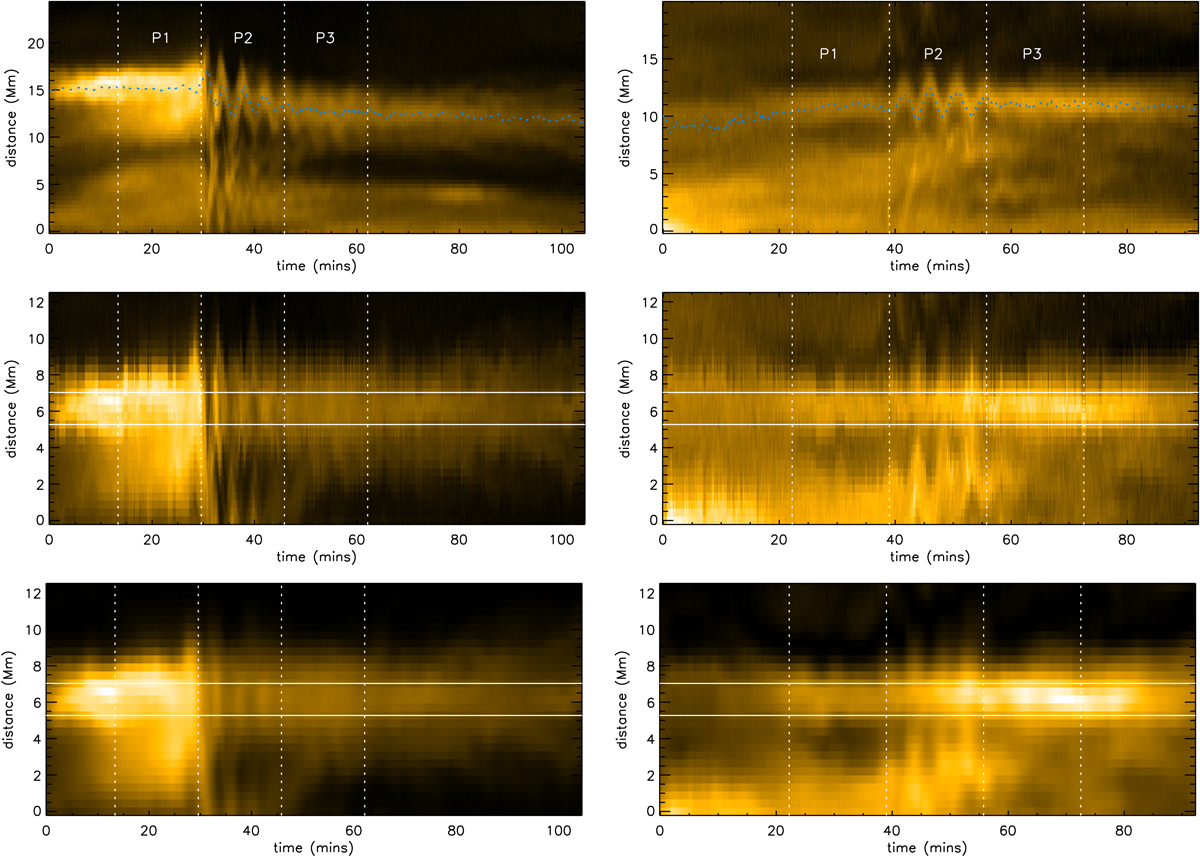
Top: TD maps at 171 Å for event 28 loop 1 (left) and event 36 loop 2 (right). The dashed blue line is the oscillation time-series obtained from Gaussian tracking of the loop position. Middle: corresponding detrended TD maps. The horizontal lines denote the averaging region, ±2 pixels about the centre pixel. Bottom: same as above, but after smoothing in time with a three-minute boxcar, and subtracting the minimum intensity at each time.
Current usage metrics show cumulative count of Article Views (full-text article views including HTML views, PDF and ePub downloads, according to the available data) and Abstracts Views on Vision4Press platform.
Data correspond to usage on the plateform after 2015. The current usage metrics is available 48-96 hours after online publication and is updated daily on week days.
Initial download of the metrics may take a while.