Free Access
Fig. 9.
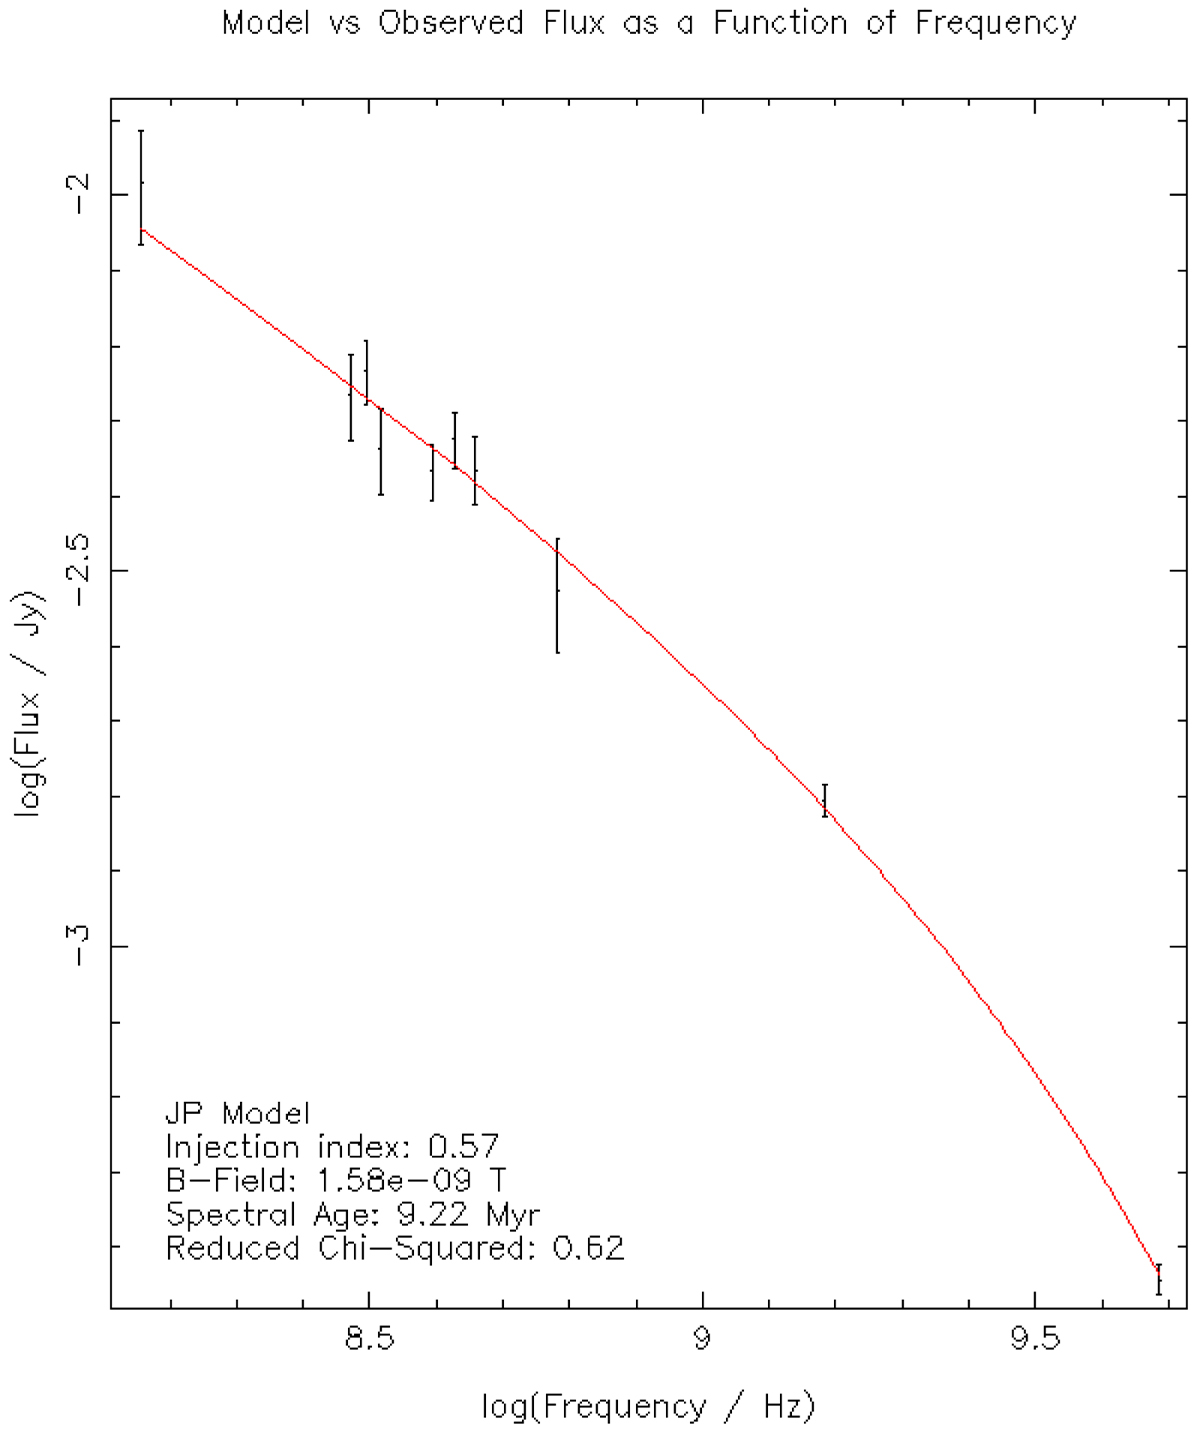
Representative radio spectrum (flux density vs. frequency) for an individual pixel with a good fitting result. Black points are observational data, and the red solid line is the best fit using the JP model. Model parameters, ages (in Myr), and statistics are shown in the bottom left corner of the panel.
Current usage metrics show cumulative count of Article Views (full-text article views including HTML views, PDF and ePub downloads, according to the available data) and Abstracts Views on Vision4Press platform.
Data correspond to usage on the plateform after 2015. The current usage metrics is available 48-96 hours after online publication and is updated daily on week days.
Initial download of the metrics may take a while.