Fig. 5.
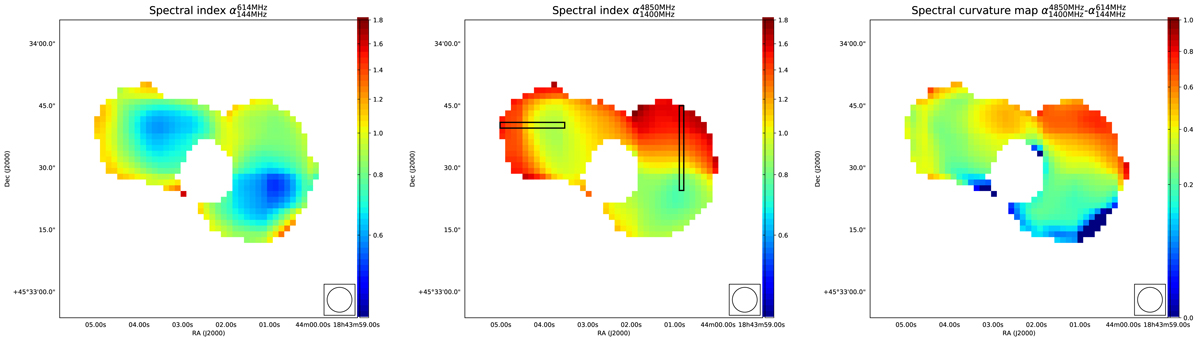
Left: spectral index map in the range 144−614 MHz. Middle: spectral index map in the range 1400−4850 MHz. Right: spectral curvature map SPC = ![]() –
–![]() . All three maps show a clear steepening moving from the inner regions of the lobes towards the edges of the lobes. The spatial resolution of all radio maps is 6 arcsec × 6 arcsec. The black rectangular regions in the middle panel have been used to study the spectral index variations throughout the lobes (see Fig. 6).
. All three maps show a clear steepening moving from the inner regions of the lobes towards the edges of the lobes. The spatial resolution of all radio maps is 6 arcsec × 6 arcsec. The black rectangular regions in the middle panel have been used to study the spectral index variations throughout the lobes (see Fig. 6).
Current usage metrics show cumulative count of Article Views (full-text article views including HTML views, PDF and ePub downloads, according to the available data) and Abstracts Views on Vision4Press platform.
Data correspond to usage on the plateform after 2015. The current usage metrics is available 48-96 hours after online publication and is updated daily on week days.
Initial download of the metrics may take a while.