Fig. 2.
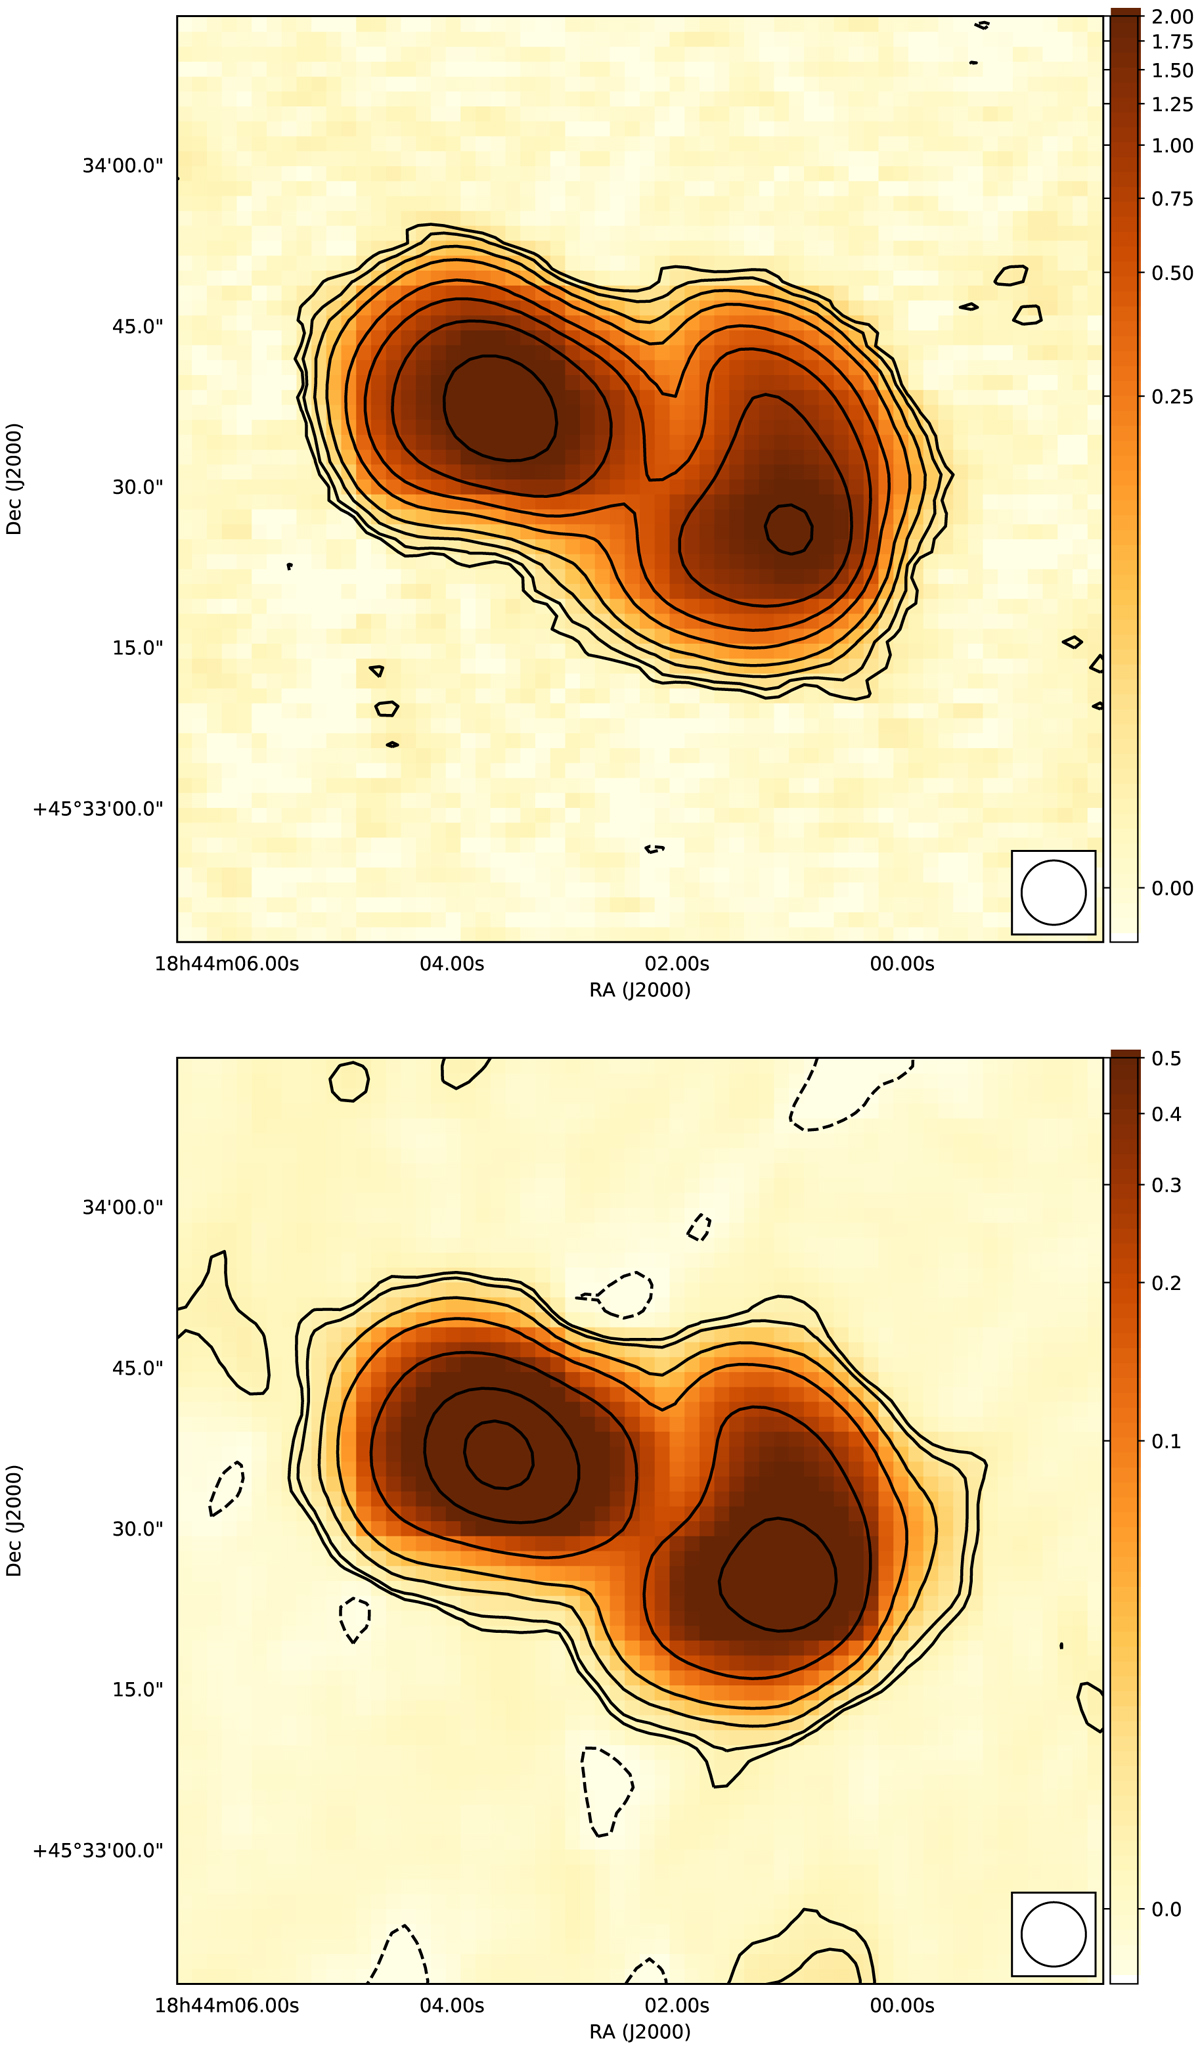
New low-frequency radio maps of 3C388, which show that the morphology of the source is consistent with previous observations at GHz frequencies. Top: LOFAR 144 MHz map with contours equal to −3, 3, 5, 10, 20, 50, 100, 200, and 500 × σ144, where σ144 = 5 mJy beam−1. Bottom: VLA 392 MHz map with contours equal to −3, 3, 5, 15, 40, 150, 500, and 1000 × σ392, where σ392 = 1.5 mJy beam−1. Colour-bars are expressed in Jy beam−1.
Current usage metrics show cumulative count of Article Views (full-text article views including HTML views, PDF and ePub downloads, according to the available data) and Abstracts Views on Vision4Press platform.
Data correspond to usage on the plateform after 2015. The current usage metrics is available 48-96 hours after online publication and is updated daily on week days.
Initial download of the metrics may take a while.