Fig. 10.
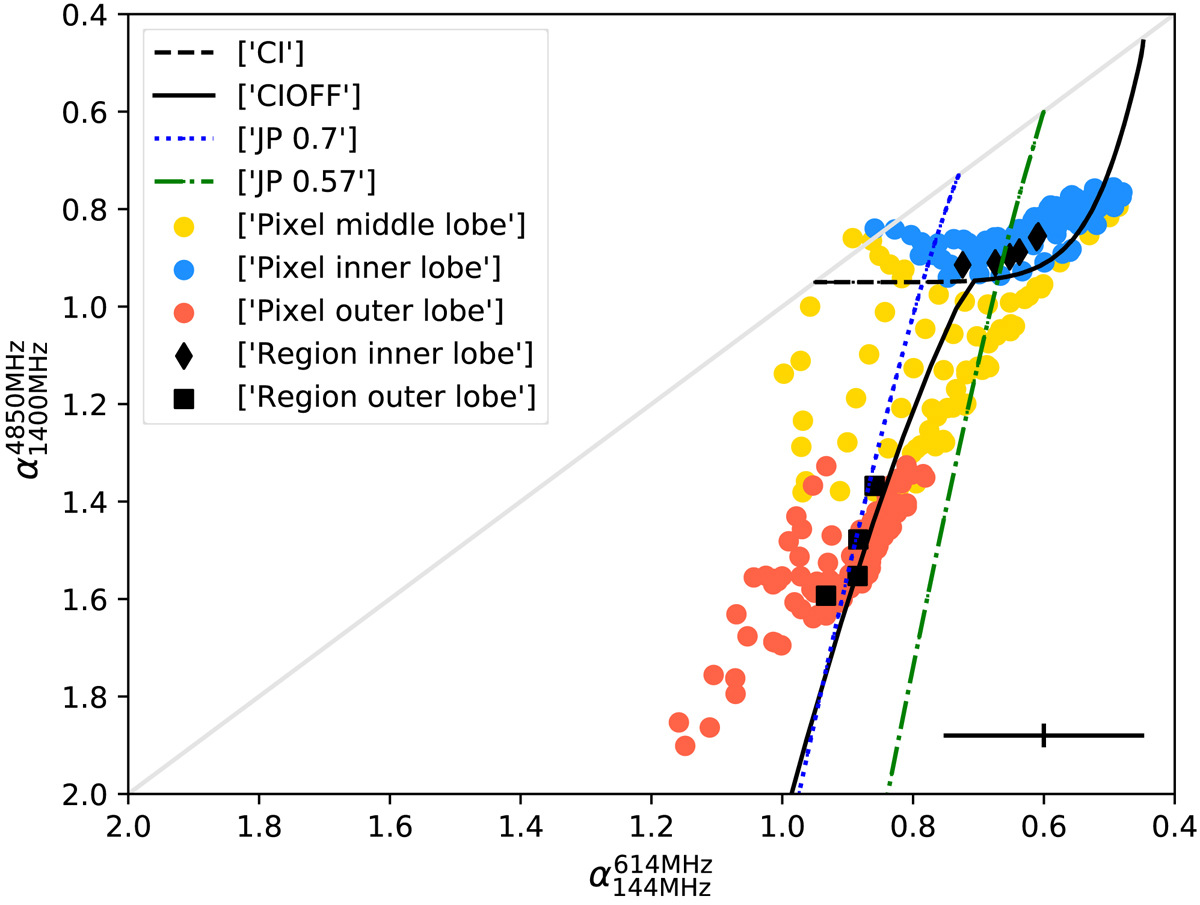
Colour–colour diagram of the western lobe showing that the spectral shape of the plasma located in different regions follows different radiative model curves. Pixel-based values are shown as circles (blue shows the inner lobe, red the outer lobe, and yellow the middle region of the lobe). Black diamonds and squares are the values computed by integrating the flux density in the regions shown in the bottom left panel of Fig. 8 for the inner and outer lobe, respectively. The grey solid line represents ![]() =
= ![]() . The other lines indicate the spectral index evolution of ageing particles for various models. In particular, the black dashed line represents a CI model with αinj = 0.45, and the black solid line represents a CIOFF model with αinj = 0.45 B = 3 μG and ton = 20 Myr. The blue dotted line represents a JP model with αinj = 0.7, and the green dash-dotted line represents a JP model with αinj = 0.57. The average error bar on the spectral indices is shown as a reference in the bottom right corner.
. The other lines indicate the spectral index evolution of ageing particles for various models. In particular, the black dashed line represents a CI model with αinj = 0.45, and the black solid line represents a CIOFF model with αinj = 0.45 B = 3 μG and ton = 20 Myr. The blue dotted line represents a JP model with αinj = 0.7, and the green dash-dotted line represents a JP model with αinj = 0.57. The average error bar on the spectral indices is shown as a reference in the bottom right corner.
Current usage metrics show cumulative count of Article Views (full-text article views including HTML views, PDF and ePub downloads, according to the available data) and Abstracts Views on Vision4Press platform.
Data correspond to usage on the plateform after 2015. The current usage metrics is available 48-96 hours after online publication and is updated daily on week days.
Initial download of the metrics may take a while.