Fig. 8.
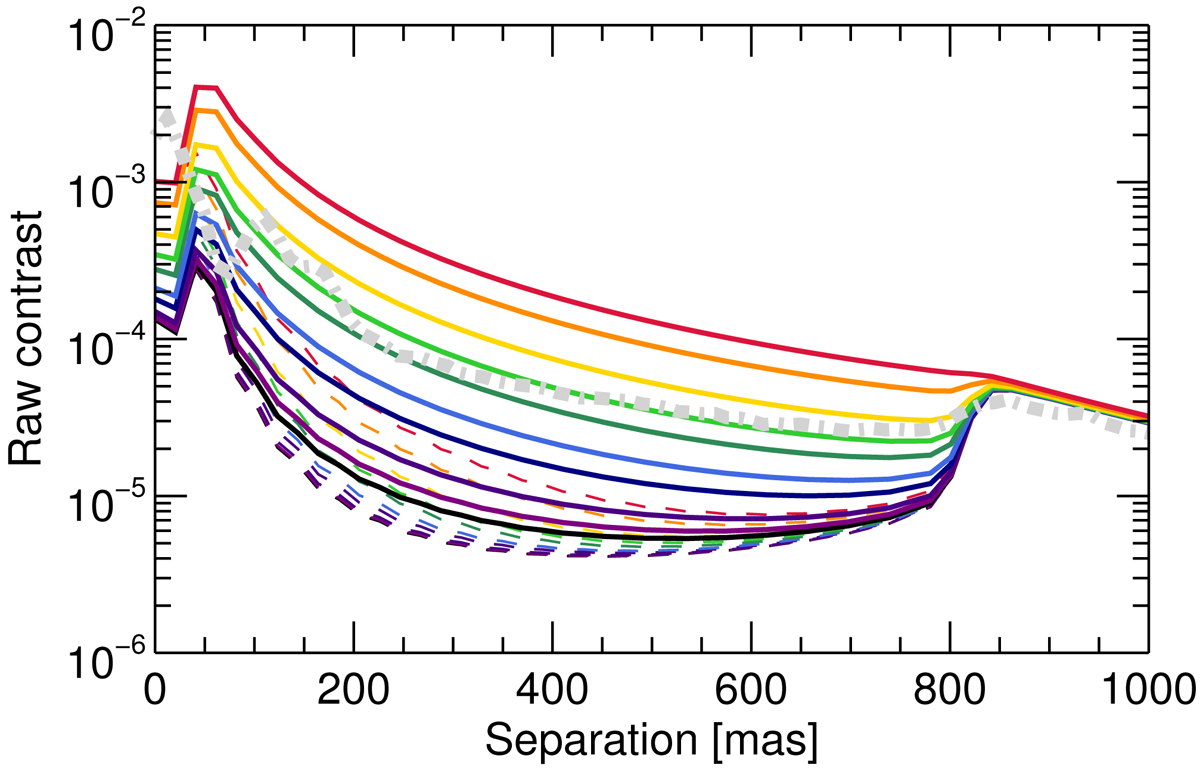
Illustration of the raw contrast as a function of separation to the star for various τ0, ranging from 12.5 ms (black) to 1.25 ms (red). From bottom to top, the curves are for turbulence coherence times of 12.5, 10, 7.5, 5.0, 4.0, 3.0, 2.5, 2.0, 1.5, and 1.25 ms. The solid lines show this along the wind direction, and the dashed lines show it along the perpendicular direction. For comparison, the gray dash-dotted line shows the raw contrast (azimuthal mean of the image) of a SPHERE-IRDIS H2-band (centered on 1.59 μm) image under median seeing, airmass, and long τ0 ∼ 9 ms.
Current usage metrics show cumulative count of Article Views (full-text article views including HTML views, PDF and ePub downloads, according to the available data) and Abstracts Views on Vision4Press platform.
Data correspond to usage on the plateform after 2015. The current usage metrics is available 48-96 hours after online publication and is updated daily on week days.
Initial download of the metrics may take a while.